Google Sheets Tutorial
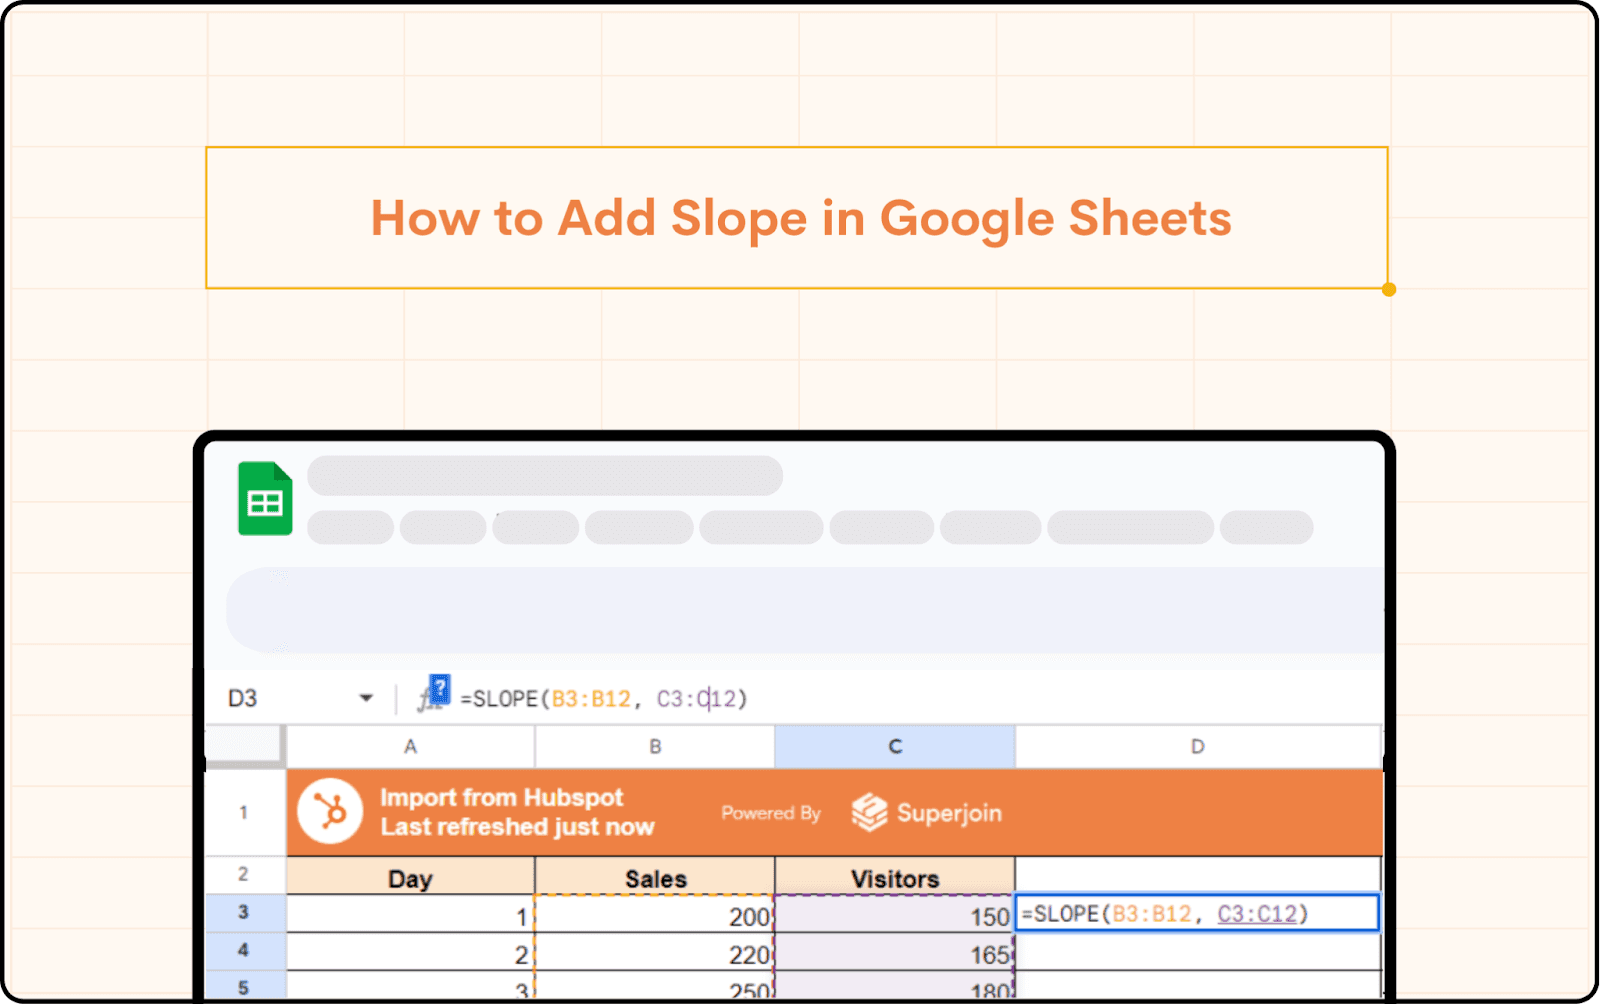
How to Add Slope in Google Sheets
Learn how to find slope on Google Sheets with step-by-step instructions, tips, and advanced techniques.
Table of Contents
Data analysis is crucial in making informed decisions, whether you're working on a small project or managing large datasets. One of the fundamental aspects of data analysis is understanding trends, and calculating the slope is an essential part of this.
In Google Sheets, there are various methods to find and analyze the slope of your data. This guide will walk you through the process of how to find slope on Google Sheets, ensuring you can harness the full potential of this powerful tool.
Understanding the Slope
Before diving into the methods of calculating slope, it's important to understand what slope is and why it's valuable. The slope is a measure of how much one variable changes in relation to another variable. In the context of a graph, the slope of a line represents the rate of change of the dependent variable (usually the Y-axis) with respect to the independent variable (usually the X-axis). This can help identify trends and make predictions based on existing data.
Benefits of Calculating Slope
Understanding how to find slope on Google Sheets can offer several benefits:
Trend Analysis: Helps in identifying trends over time.
Prediction: Enables forecasting future values based on historical data.
Data Interpretation: Simplifies the understanding of relationships between variables.
Decision Making: Supports data-driven decision-making by providing clear insights.
Calculating Slope with the SLOPE Function
The SLOPE function in Google Sheets is a straightforward way to calculate the slope of a dataset. Here’s how you can use it:
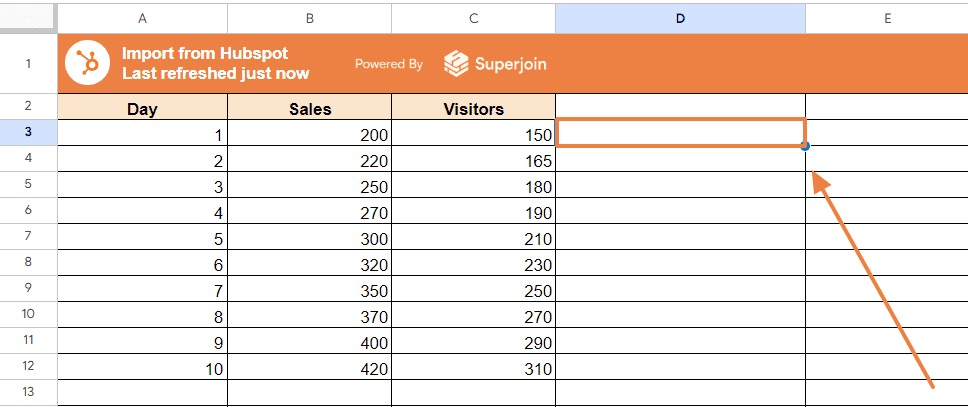
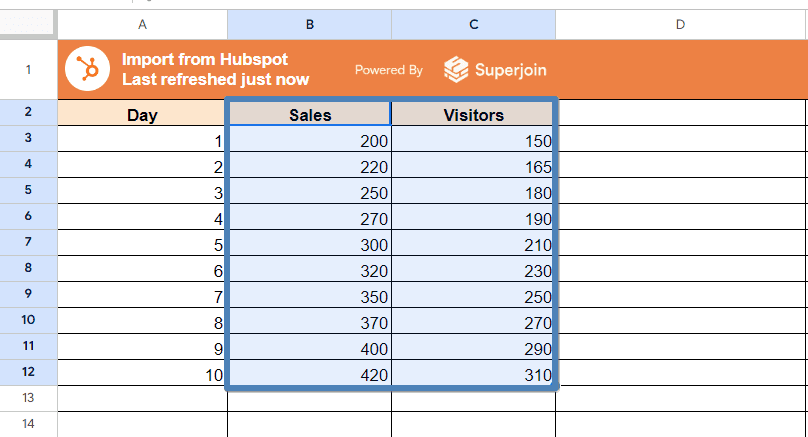
Prepare your data: Ensure you have two columns of data, one for the independent variable (X) and one for the dependent variable (Y).
Select a cell where you want the slope to be displayed.
3. Enter the formula:
=SLOPE(y_values, x_values)
Replace y_values and x_values with the actual range of your data. For example:
=SLOPE(B3:B12, C3:C12)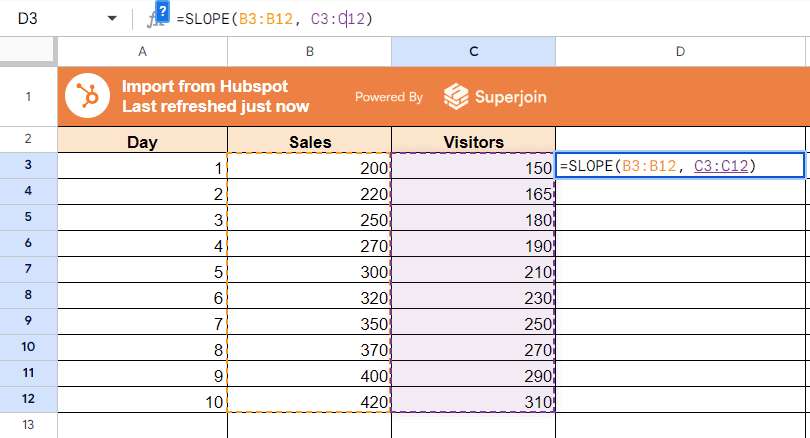
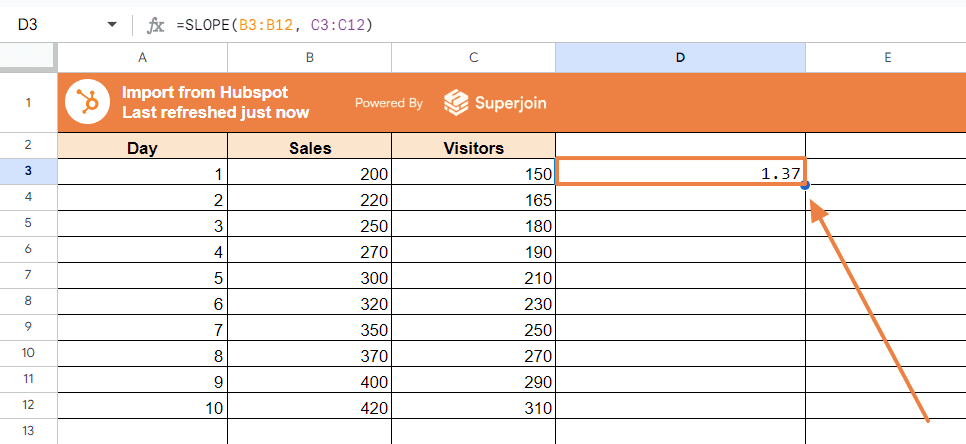
Press Enter, and the slope will be calculated and displayed in the selected cell.
Finding Slope of a Trendline in Google Sheets
Another effective method to find the slope is by using the charting feature:
Select your data range: Highlight the data you want to plot.
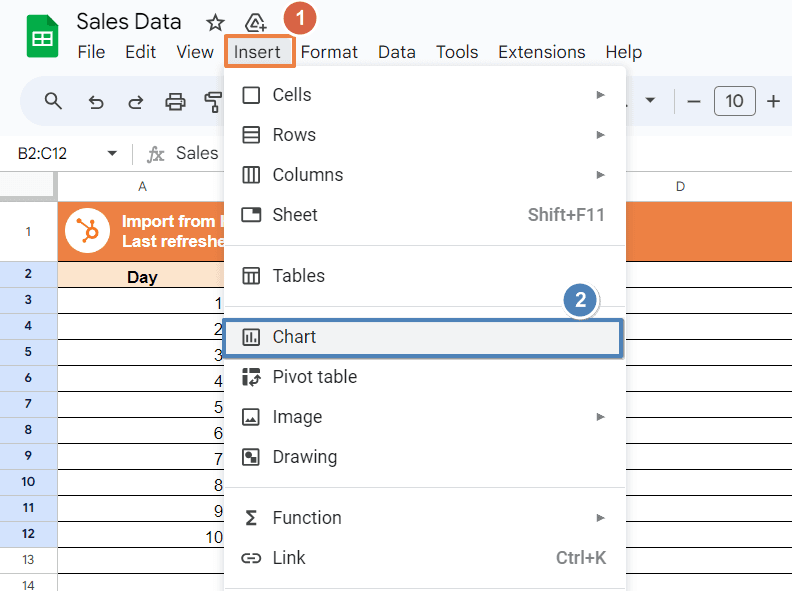
Go to Insert > Chart to create a chart.
In the Chart Editor, choose Scatter chart from the Chart type menu.

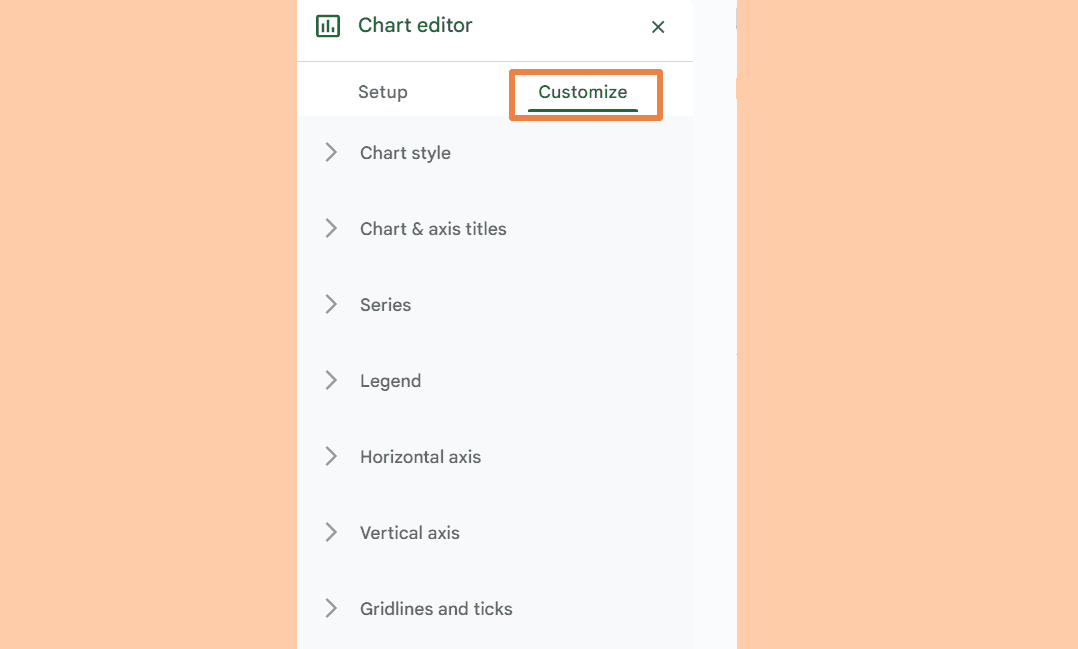
Click on the Customize tab in the Chart Editor.
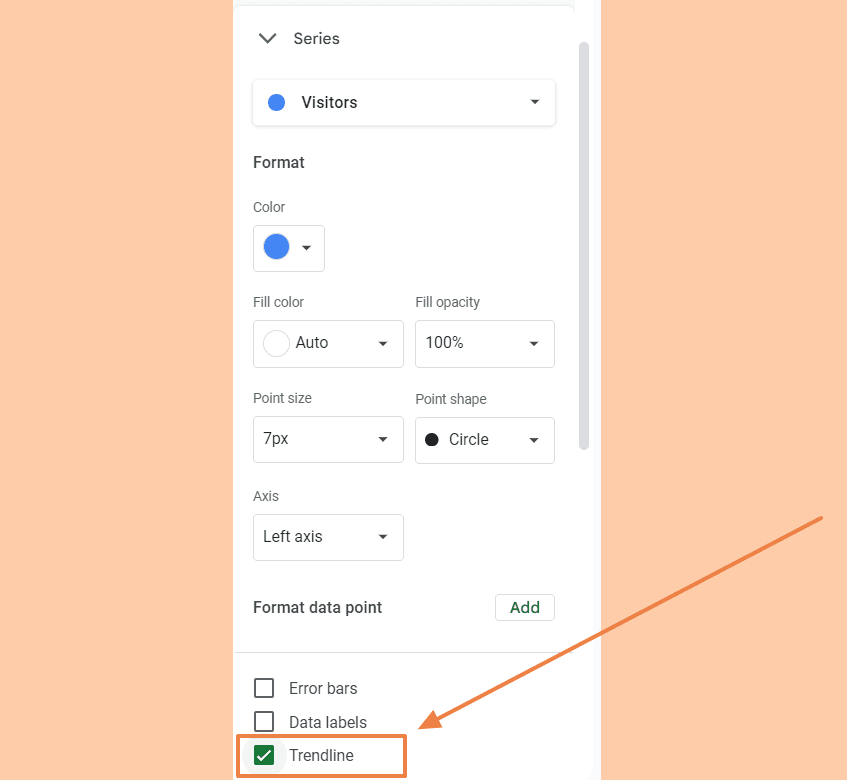
Expand the Series section, and check the box for Trendline.
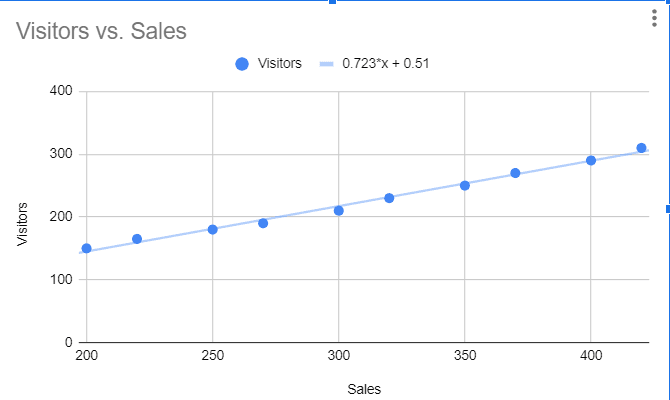
Scroll down within the Series section, and select Label to show the equation on the chart.
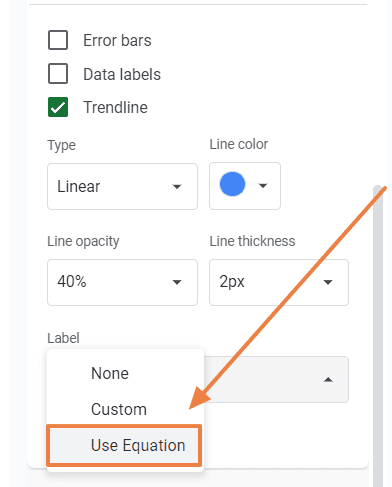
The equation displayed on the chart will be in the form of y = mx + b, where m is the slope of the trendline.
For more advanced data manipulation techniques, check out our Ultimate Guide to VLOOKUP in Google Sheets.
Conclusion
Understanding how to find slope on Google Sheets is an invaluable skill for anyone working with data. Whether you use the SLOPE function, create a trendline in a chart, perform linear regression, each method provides unique advantages. By mastering these techniques, you can enhance your data analysis capabilities and make more informed decisions based on your data.
Say Goodbye To Tedious Data Exports! 🚀
Are you tired of the hassle of manually moving data from various tools into Google Sheets? Superjoin has a solution for you.
Superjoin is a Google Sheets add-on that automatically connects your favorite SaaS tools to your spreadsheets. It pulls data directly into Google Sheets, allowing you to create reports that update themselves without any manual work on your part.
Data analysis is crucial in making informed decisions, whether you're working on a small project or managing large datasets. One of the fundamental aspects of data analysis is understanding trends, and calculating the slope is an essential part of this.
In Google Sheets, there are various methods to find and analyze the slope of your data. This guide will walk you through the process of how to find slope on Google Sheets, ensuring you can harness the full potential of this powerful tool.
Understanding the Slope
Before diving into the methods of calculating slope, it's important to understand what slope is and why it's valuable. The slope is a measure of how much one variable changes in relation to another variable. In the context of a graph, the slope of a line represents the rate of change of the dependent variable (usually the Y-axis) with respect to the independent variable (usually the X-axis). This can help identify trends and make predictions based on existing data.
Benefits of Calculating Slope
Understanding how to find slope on Google Sheets can offer several benefits:
Trend Analysis: Helps in identifying trends over time.
Prediction: Enables forecasting future values based on historical data.
Data Interpretation: Simplifies the understanding of relationships between variables.
Decision Making: Supports data-driven decision-making by providing clear insights.
Calculating Slope with the SLOPE Function
The SLOPE function in Google Sheets is a straightforward way to calculate the slope of a dataset. Here’s how you can use it:
Prepare your data: Ensure you have two columns of data, one for the independent variable (X) and one for the dependent variable (Y).
Select a cell where you want the slope to be displayed.
3. Enter the formula:
=SLOPE(y_values, x_values)
Replace y_values and x_values with the actual range of your data. For example:
=SLOPE(B3:B12, C3:C12)Press Enter, and the slope will be calculated and displayed in the selected cell.
Finding Slope of a Trendline in Google Sheets
Another effective method to find the slope is by using the charting feature:
Select your data range: Highlight the data you want to plot.
Go to Insert > Chart to create a chart.
In the Chart Editor, choose Scatter chart from the Chart type menu.
Click on the Customize tab in the Chart Editor.
Expand the Series section, and check the box for Trendline.
Scroll down within the Series section, and select Label to show the equation on the chart.
The equation displayed on the chart will be in the form of y = mx + b, where m is the slope of the trendline.
For more advanced data manipulation techniques, check out our Ultimate Guide to VLOOKUP in Google Sheets.
Conclusion
Understanding how to find slope on Google Sheets is an invaluable skill for anyone working with data. Whether you use the SLOPE function, create a trendline in a chart, perform linear regression, each method provides unique advantages. By mastering these techniques, you can enhance your data analysis capabilities and make more informed decisions based on your data.
Say Goodbye To Tedious Data Exports! 🚀
Are you tired of the hassle of manually moving data from various tools into Google Sheets? Superjoin has a solution for you.
Superjoin is a Google Sheets add-on that automatically connects your favorite SaaS tools to your spreadsheets. It pulls data directly into Google Sheets, allowing you to create reports that update themselves without any manual work on your part.
FAQs
How do I find the slope of a line in Google Sheets using charting?
How do I find the slope of a line in Google Sheets using charting?
Can I automate slope calculations in Google Sheets?
Can I automate slope calculations in Google Sheets?
How do I export my Google Sheets data with checkboxes to Excel?
How do I export my Google Sheets data with checkboxes to Excel?
Automatic Data Pulls
Visual Data Preview
Set Alerts
other related blogs

Try it now