Redshift
Connect Redshift to Google Sheets in one-click
Automatically pull live data from Redshift to Google Sheets
Redshift
Connect Redshift to Google Sheets in one-click
Automatically pull live data from Redshift to Google Sheets
Redshift
Connect Redshift to Google Sheets in one-click
Automatically pull live data from Redshift to Google Sheets
Loved by 10K+ users across 400+ companies
features
Unleash the Power of Analytics with Superjoin
One-Click Connectors
Connect to unlimited data sources and pull data onto Google Sheets in just one click using Superjoin at no extra cost.
One-Click Connectors
Connect to unlimited data sources and pull data onto Google Sheets in just one click using Superjoin at no extra cost.
Auto-Refreshes
Set up schedules to automatically update your Google Sheet with the latest data from your data source. No more CSV exports ever.
Auto-Refreshes
Set up schedules to automatically update your Google Sheet with the latest data from your data source. No more CSV exports ever.
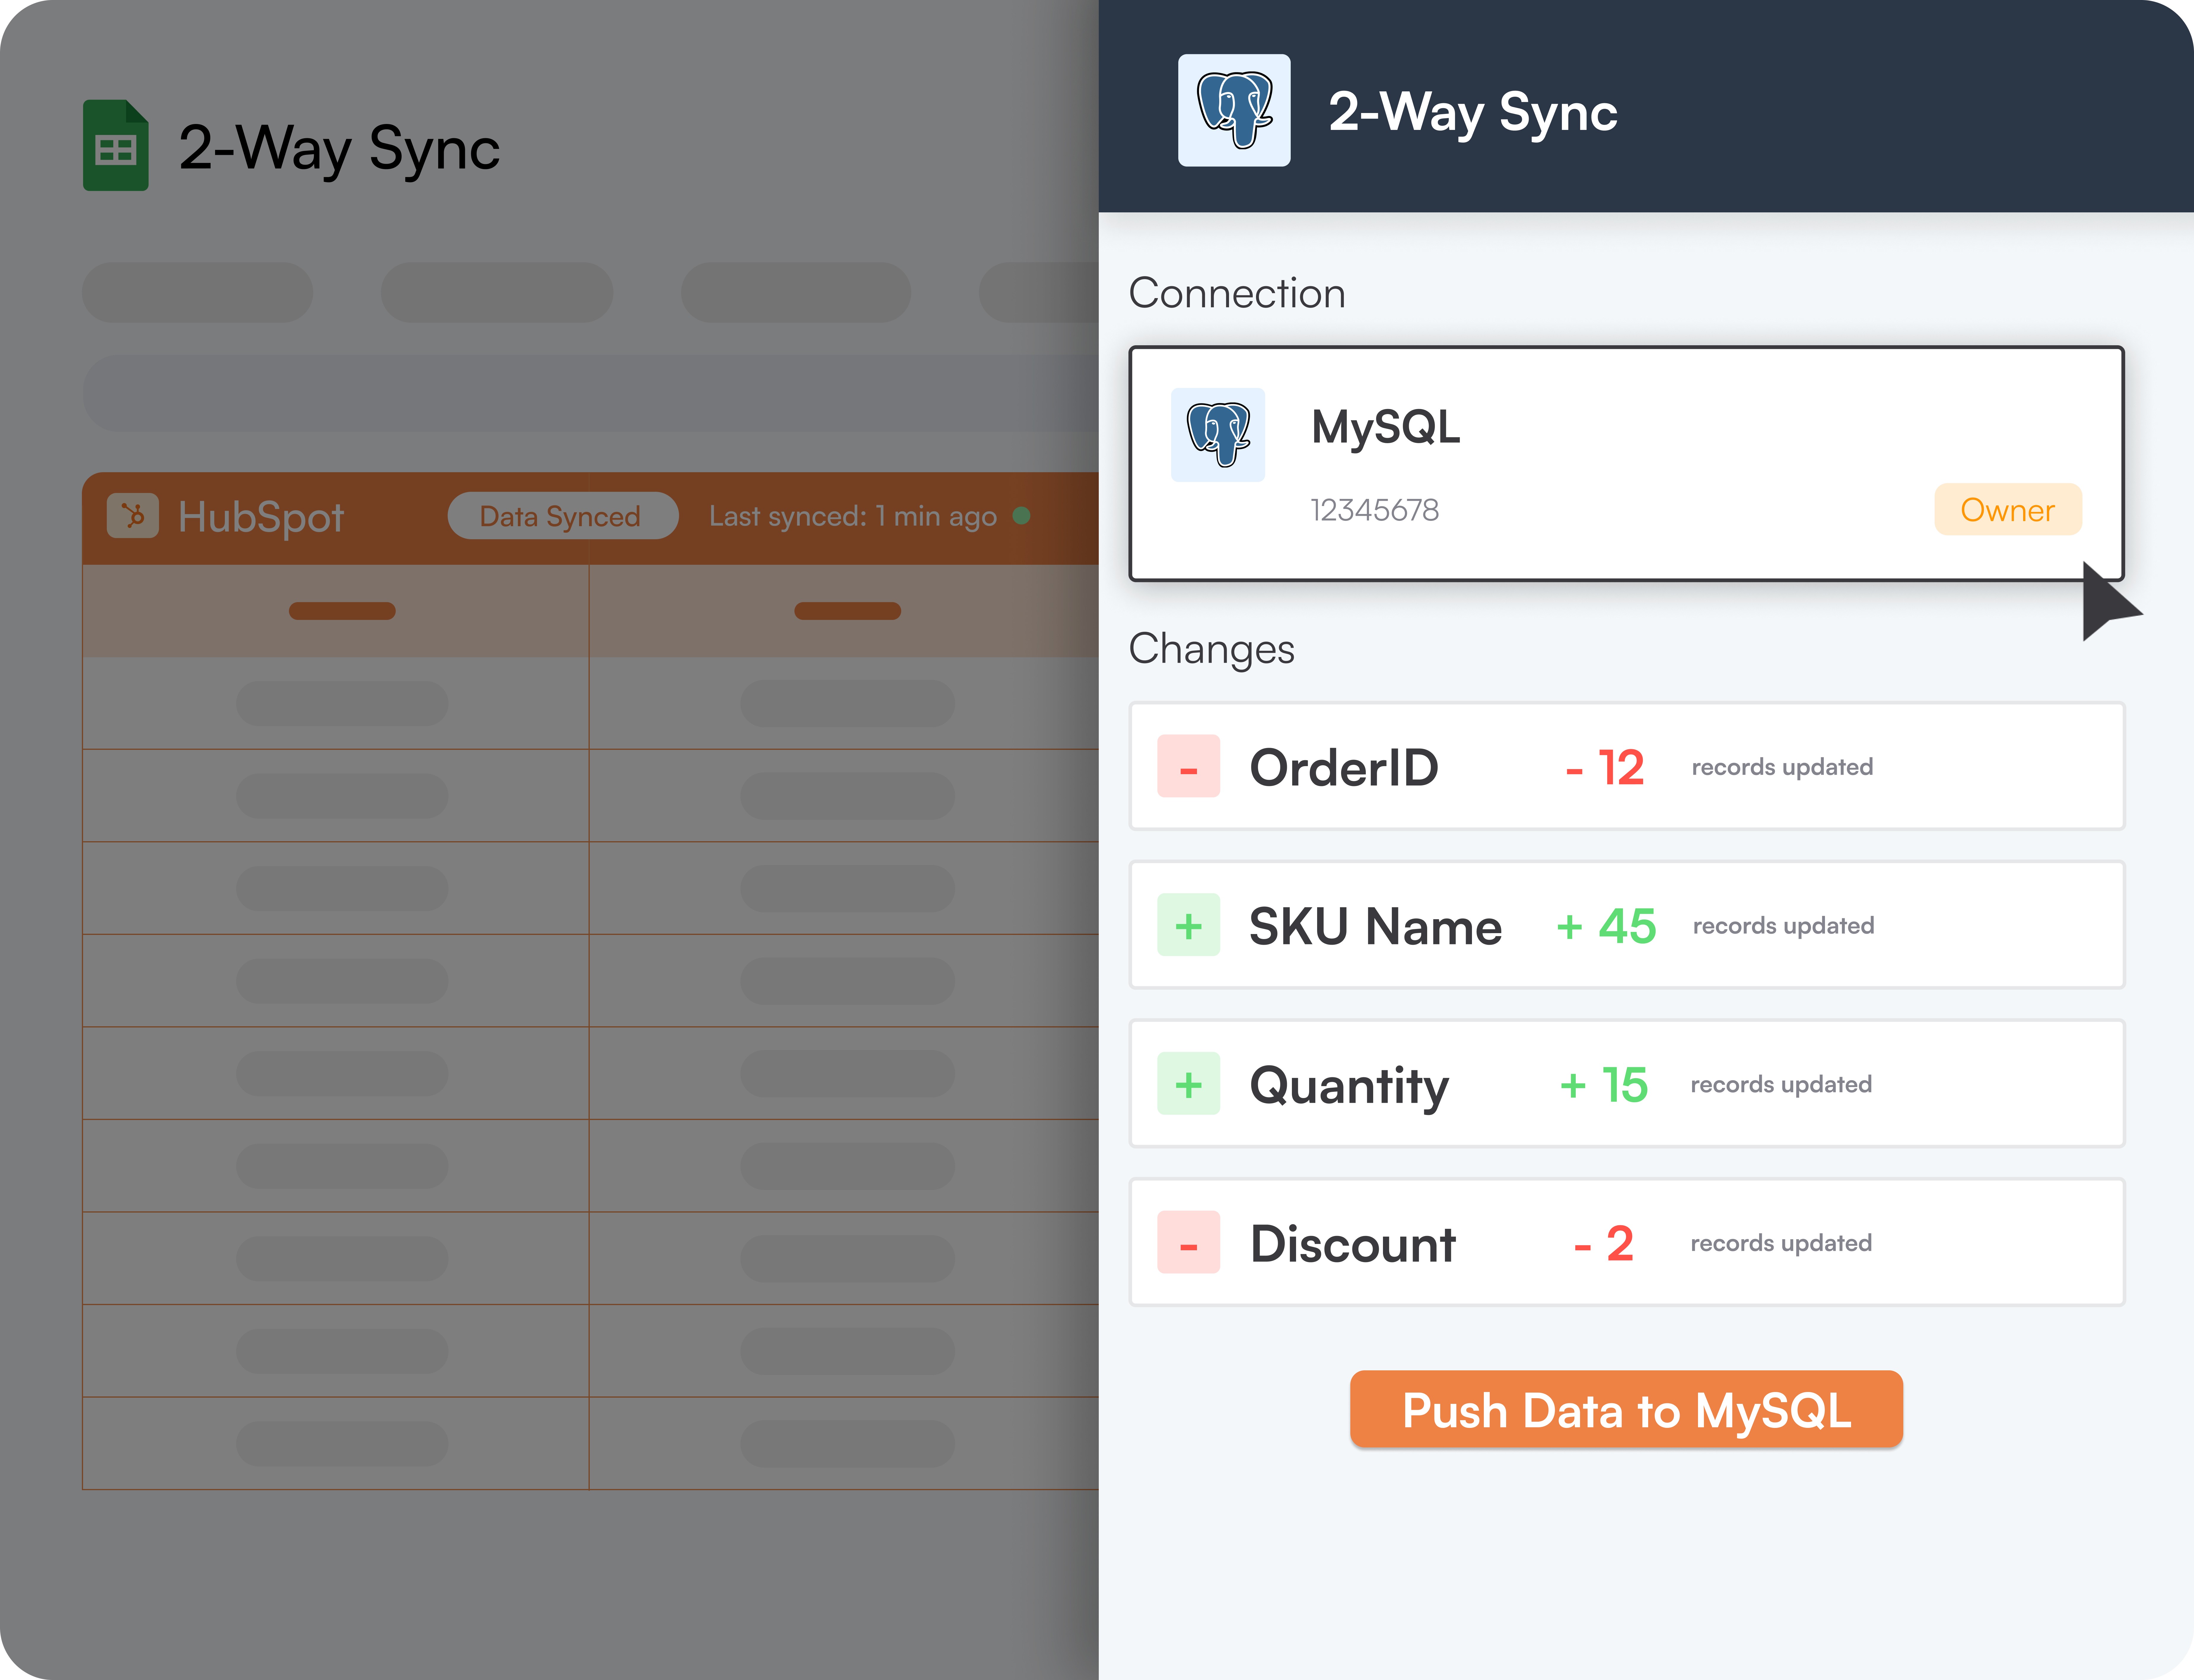
2-Way Sync
Push data onto your data source from Google Sheets using Superjoin.
2-Way Sync
Push data onto your data source from Google Sheets using Superjoin.
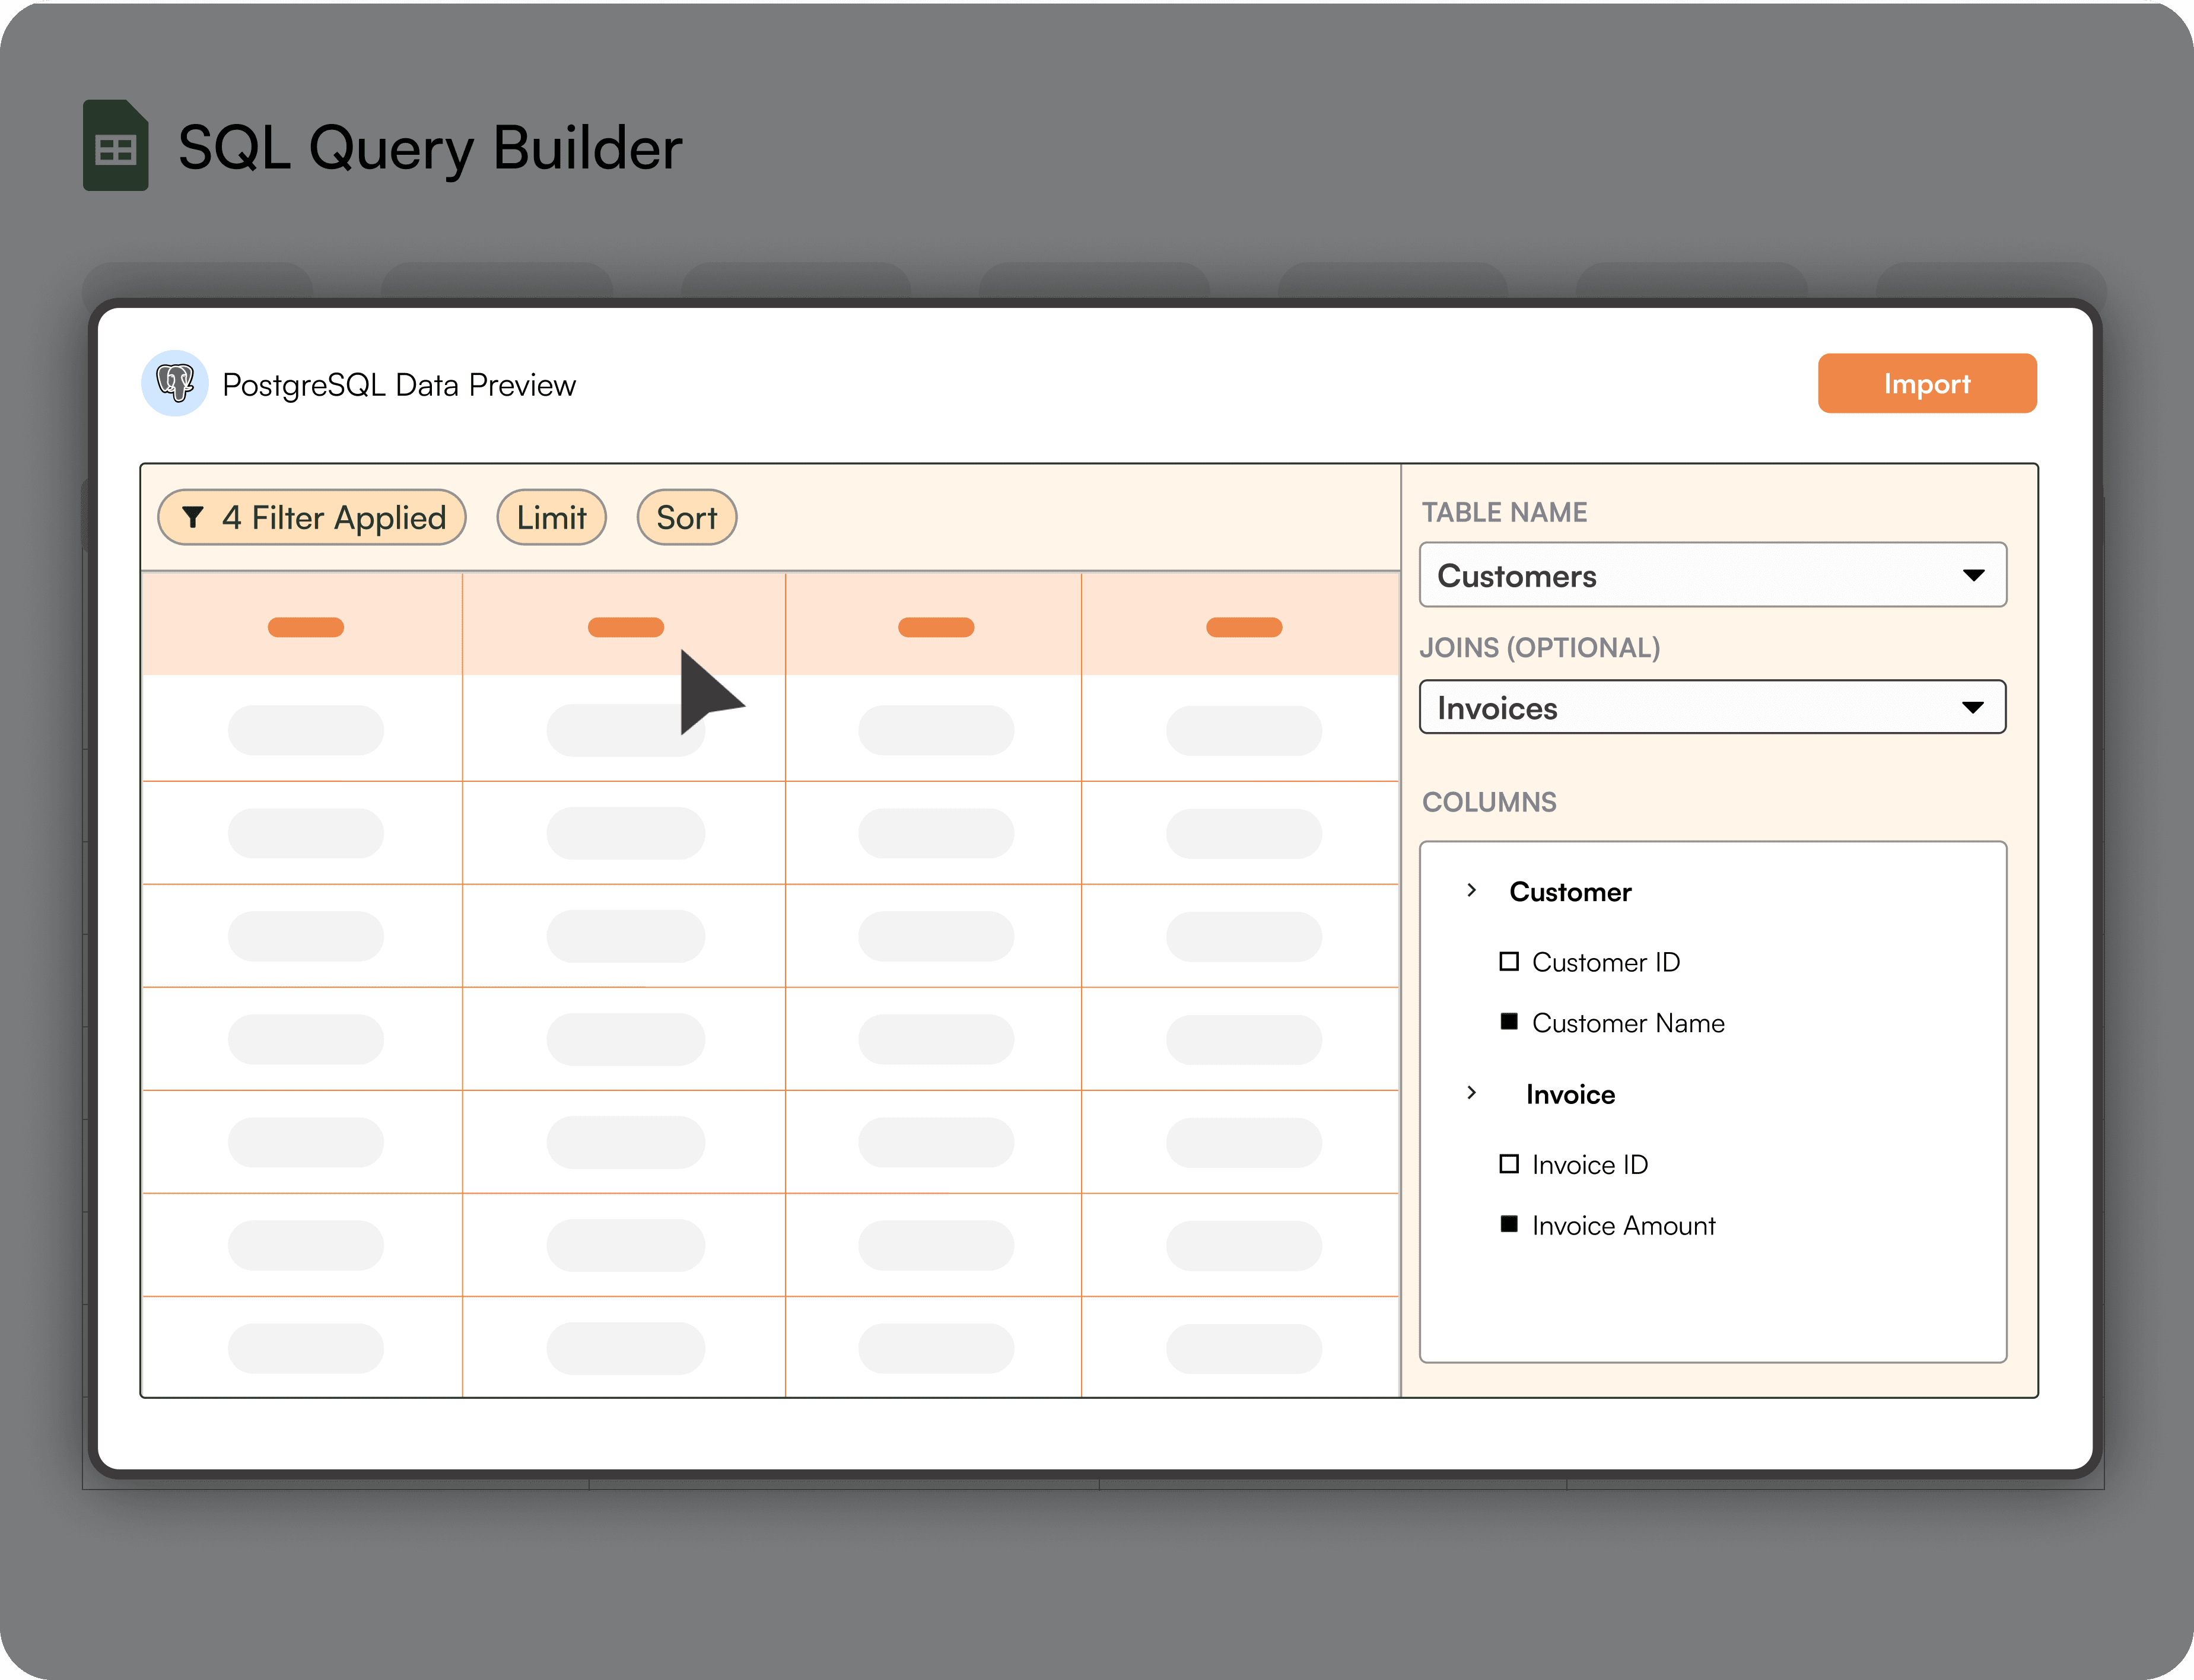
Build Queries with Ease
Visual SQL Query Builder allows you to build SQL queries visually. Or you can also write your own SQL queries.
Build Queries with Ease
Visual SQL Query Builder allows you to build SQL queries visually. Or you can also write your own SQL queries.
One-Click Connectors
Connect to unlimited data sources and pull data onto Google Sheets in just one click using Superjoin at no extra cost.
One-Click Connectors
Connect to unlimited data sources and pull data onto Google Sheets in just one click using Superjoin at no extra cost.
Auto-Refreshes
Set up schedules to automatically update your Google Sheet with the latest data from your data source. No more CSV exports ever.
Auto-Refreshes
Set up schedules to automatically update your Google Sheet with the latest data from your data source. No more CSV exports ever.
2-Way Sync
Push data onto your data source from Google Sheets using Superjoin.
2-Way Sync
Push data onto your data source from Google Sheets using Superjoin.
Build Queries with Ease
Visual SQL Query Builder allows you to build SQL queries visually. Or you can also write your own SQL queries.
Build Queries with Ease
Visual SQL Query Builder allows you to build SQL queries visually. Or you can also write your own SQL queries.
Centralised Query Manager
Store all the SQL queries in a Query Library for all the teams. One place for different teams to access their queries. Never share queries or CSVs over Slack ever again.
Centralised Query Manager
Store all the SQL queries in a Query Library for all the teams. One place for different teams to access their queries. Never share queries or CSVs over Slack ever again.
Update and Publish Queries
Update SQL queries from one Central Query library for all the teams. Always ensure all the teams have the most updated SQL queries.
Update and Publish Queries
Update SQL queries from one Central Query library for all the teams. Always ensure all the teams have the most updated SQL queries.
get your metrics right
Calculators
Calculators
Calculators
Integrations
Similar Integrations
know your metrics
Related Metrics
Related Metrics
Related Metrics
Activation Rate
The percentage of users who complete a key action that signifies they are successfully using a product or service. This metric helps businesses understand how effectively they are onboarding and engaging new users.
Activation Rate
The percentage of users who complete a key action that signifies they are successfully using a product or service. This metric helps businesses understand how effectively they are onboarding and engaging new users.
Activation Rate
The percentage of users who complete a key action that signifies they are successfully using a product or service. This metric helps businesses understand how effectively they are onboarding and engaging new users.
Annual Recurring Revenue (ARR)
The total revenue that a company expects to generate from its subscriptions over a year. It is calculated by multiplying the MRR by 12. This metric is useful for long-term financial planning and assessing the overall growth of a subscription business.
Annual Recurring Revenue (ARR)
The total revenue that a company expects to generate from its subscriptions over a year. It is calculated by multiplying the MRR by 12. This metric is useful for long-term financial planning and assessing the overall growth of a subscription business.
Annual Recurring Revenue (ARR)
The total revenue that a company expects to generate from its subscriptions over a year. It is calculated by multiplying the MRR by 12. This metric is useful for long-term financial planning and assessing the overall growth of a subscription business.
Average Handle Time
The average time taken by customer service agents to handle a call or interaction from start to finish. This includes talk time and any related tasks. Lower average handle times can indicate more efficient service processes.
Average Handle Time
The average time taken by customer service agents to handle a call or interaction from start to finish. This includes talk time and any related tasks. Lower average handle times can indicate more efficient service processes.
Average Handle Time
The average time taken by customer service agents to handle a call or interaction from start to finish. This includes talk time and any related tasks. Lower average handle times can indicate more efficient service processes.
Average Revenue Per Account (ARPA)
The average revenue generated per user or account. It is calculated by dividing the total revenue by the number of accounts. This metric helps businesses understand the revenue contribution of each customer and optimize pricing strategies.
Average Revenue Per Account (ARPA)
The average revenue generated per user or account. It is calculated by dividing the total revenue by the number of accounts. This metric helps businesses understand the revenue contribution of each customer and optimize pricing strategies.
Average Revenue Per Account (ARPA)
The average revenue generated per user or account. It is calculated by dividing the total revenue by the number of accounts. This metric helps businesses understand the revenue contribution of each customer and optimize pricing strategies.
Load More
Testimonials
Loved by industry leaders.
What our users say
“Saves us a lot of time”
Superjoin refreshes all the data dynamically, also gives us a real-time view of the data, and cuts down on any dependency.
Director of sales operation
WayLeadr
“You’re a game-changer!”
We highly recommend Superjoin to anyone seeking to automate data, streamline processes, and empower data-driven decision-making.
Chief Business Officer
Pathfnder.io
“Superjoin is a fantastic tool”
I would highly recommend it to anyone managing reporting out of spreadsheets, especially for companies that do not have a data engineer or data warehouse.
Chief Technical Officer
Aspire
“Saves us a lot of time”
Superjoin refreshes all the data dynamically, also gives us a real-time view of the data, and cuts down on any dependency.
Director of sales operation
WayLeadr
“You’re a game-changer!”
We highly recommend Superjoin to anyone seeking to automate data, streamline processes, and empower data-driven decision-making.
Chief Business Officer
Pathfnder.io
“Superjoin is a fantastic tool”
I would highly recommend it to anyone managing reporting out of spreadsheets, especially for companies that do not have a data engineer or data warehouse.
Chief Technical Officer
Aspire
“Saves us a lot of time”
Superjoin refreshes all the data dynamically, also gives us a real-time view of the data, and cuts down on any dependency.
Director of sales operation
WayLeadr
“You’re a game-changer!”
We highly recommend Superjoin to anyone seeking to automate data, streamline processes, and empower data-driven decision-making.
Chief Business Officer
Pathfnder.io
“Superjoin is a fantastic tool”
I would highly recommend it to anyone managing reporting out of spreadsheets, especially for companies that do not have a data engineer or data warehouse.
Chief Technical Officer
Aspire
Try within 2 minutes. no Card required
Gathering all your data has never been simpler.
Install for Free
Automatic Data Pulls
Set Alerts
Visual Data Preview
other related blogs
Integrations