RevOps
How to Analyze Sales Rep Performance in Excel
Analyze sales rep performance in Microsoft Excel: Guide to strategies, formulas, and visualizations for optimizing team productivity.
Table of Contents
Sales performance analysis is crucial for understanding the effectiveness of your sales team and identifying areas for improvement. Microsoft Excel offers a robust and accessible platform for conducting detailed performance analyses without the need for expensive software. This blog will walk you through the steps to analyze sales rep performance using Microsoft Excel, providing a comprehensive guide to creating insightful and actionable reports.
Benefits of Analyzing Sales Rep Performance
Better Sales Strategies: Companies can create more successful sales strategies and procedures by knowing what makes top workers successful.
Optimized Resource Allocation: Companies can more effectively manage resources by identifying which sales representatives are performing well, guaranteeing that the most important accounts are being handled by the best representatives.
Increased Sales and income: Businesses can boost sales and income by comprehending and imitating the actions of high performers.
Improved Customer Insights: Performance analysis may show how various methods affect customer happiness and relationships, which can result in improved customer service and retention tactics.
Improved Planning and Forecasting: Performance data offers insightful information that can increase the precision of strategic planning and sales forecasting.
Finding Best Practices: By identifying the strategies and methods employed by successful sales representatives, best practices may be developed and disseminated throughout the organization.
Setting Up Your Data
Step 1: Collecting Data
Begin by gathering all relevant data. This might include:
Date
Sales rep names
Sales targets
Actual sales
Number of calls made
Meetings scheduled
Deals closed
Revenue generated
Client feedback
Step 2: Organizing Data in Excel
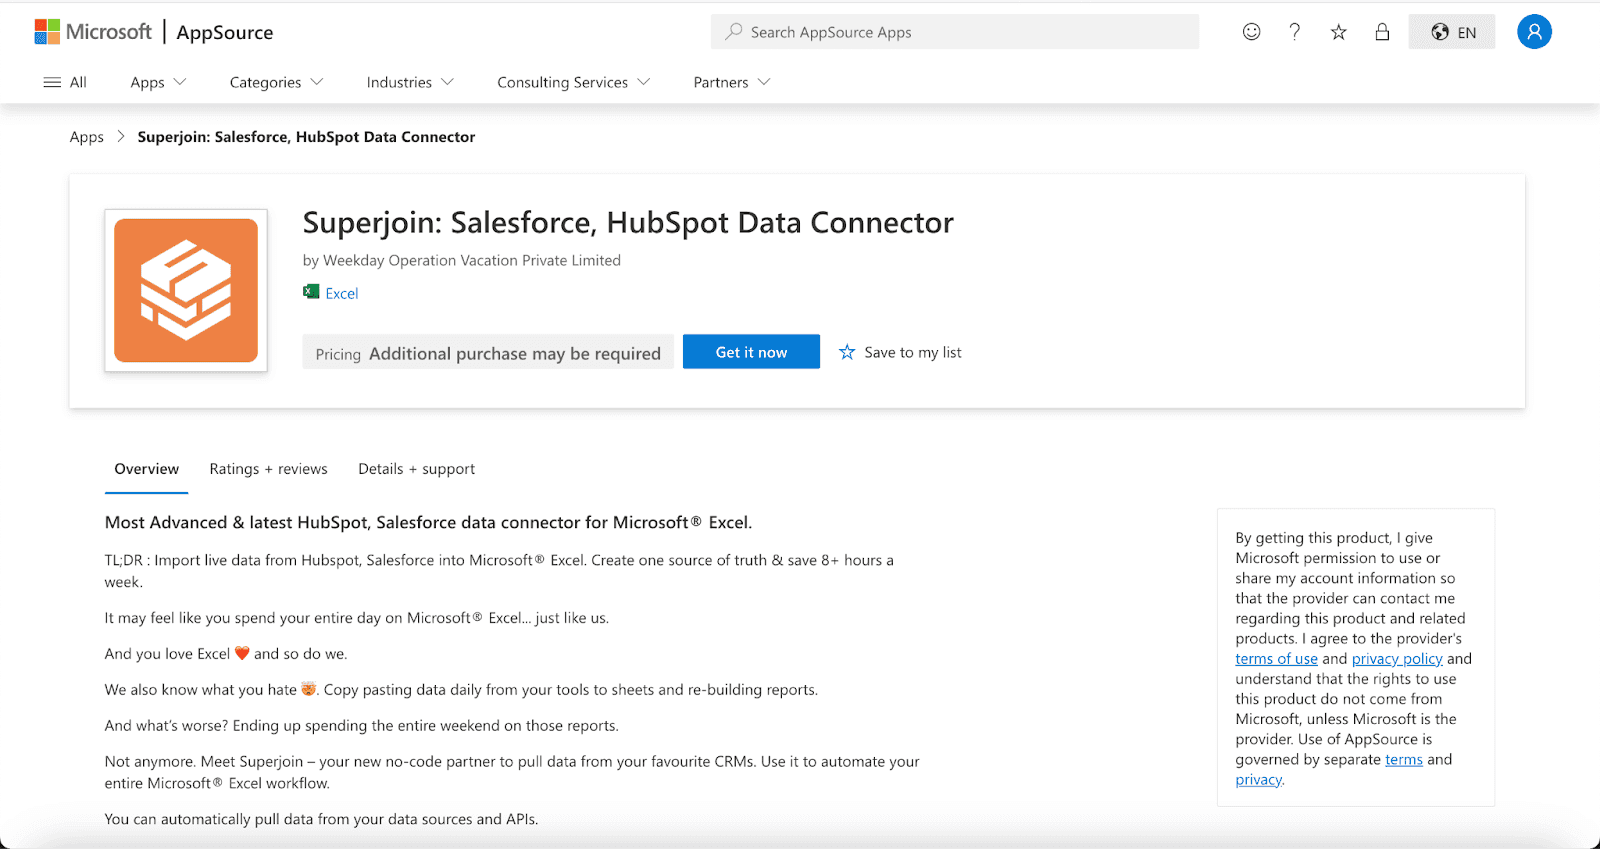
Install Superjoin on Microsoft Excel and data import from Hubspot. To install on Excel,
Open this link, click on Get it now.
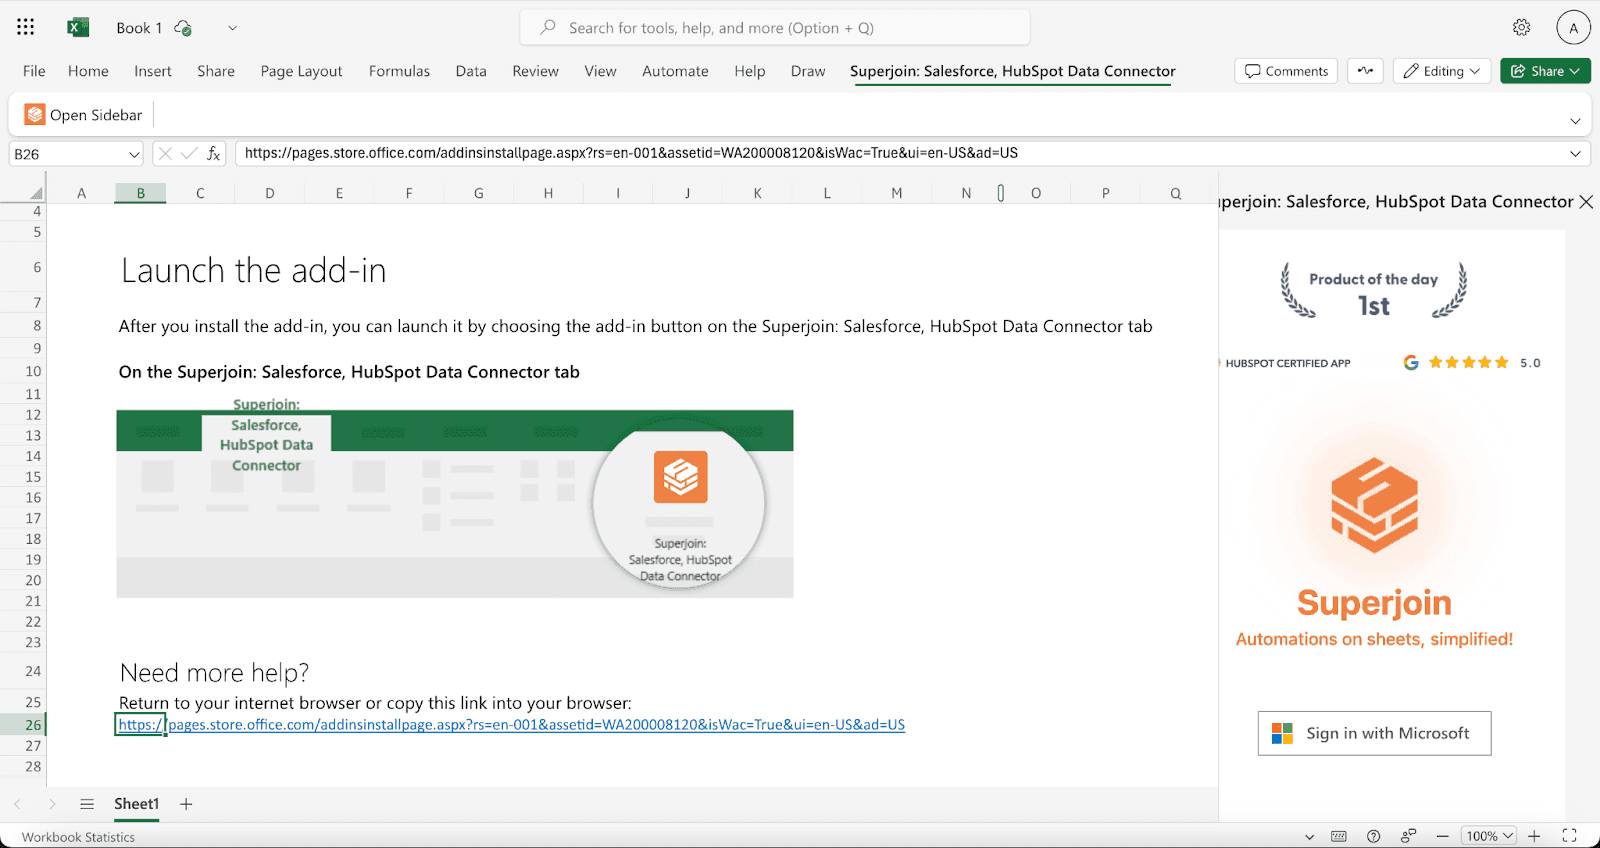
Once installed, click on Open in Excel or Try using it online (for Excel online).

Launch Superjoin by opening the add-in and clicking on Open Sidebar. Login with your Microsoft account to start using Superjoin.
Steps Involved in Creating a Sales Dashboard
Step 1: Setting Up the Dashboard Sheet
Create a new sheet in your Excel Sheet file, named "Dashboard".
Step 2: Key Metrics Display
Display key metrics using cell references and formulas to pull data from your raw data sheet. Use functions like `AVERAGE`, `SUM`, and `COUNTIF` to calculate the overall performance metrics.
Step 3: Dynamic Filters
Add data validation and filters to allow dynamic analysis by date, sales rep, or other categories.
Analyzing Sales Data with Excel
1. Using Basic Formulas
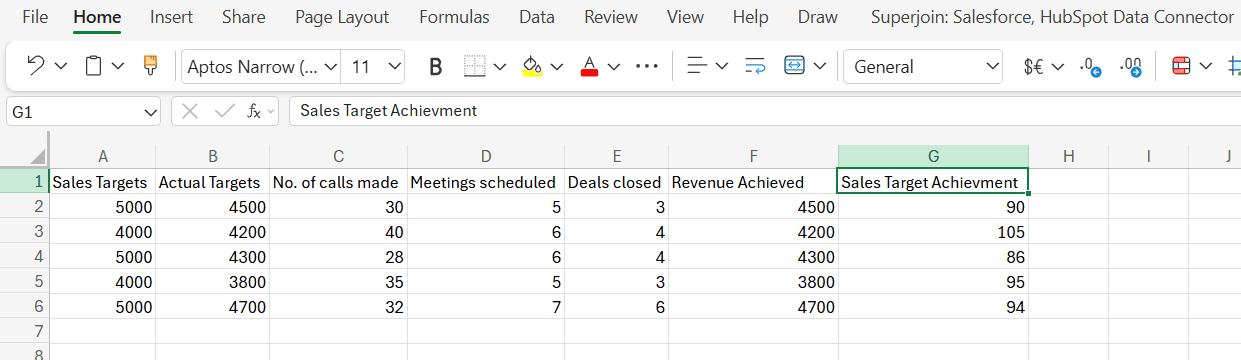
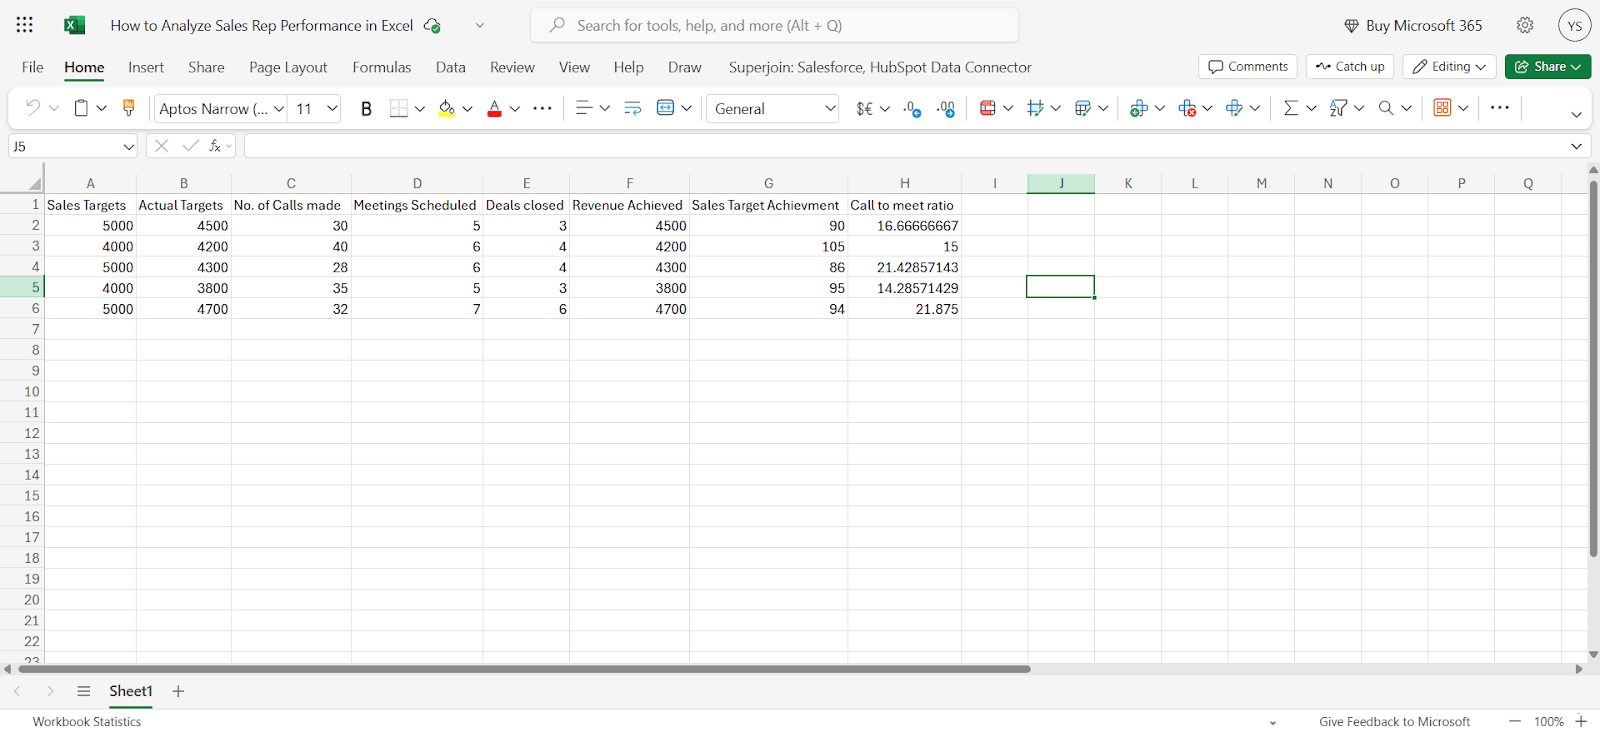
Example 1: Calculating Sales Target Achievement
=B2/A2 * 100Drag the formula to all the cells below.This formula will calculate the sales target achievement for all rows.
Example 2: Call-to-Meeting Ratio
=D2/C2 *100Drag the formula to all the cells below.This formula will calculate the sales target achievement for all rows.
2. Pivot Tables
Pivot tables are a powerful feature in Microsoft Excel for summarizing data.
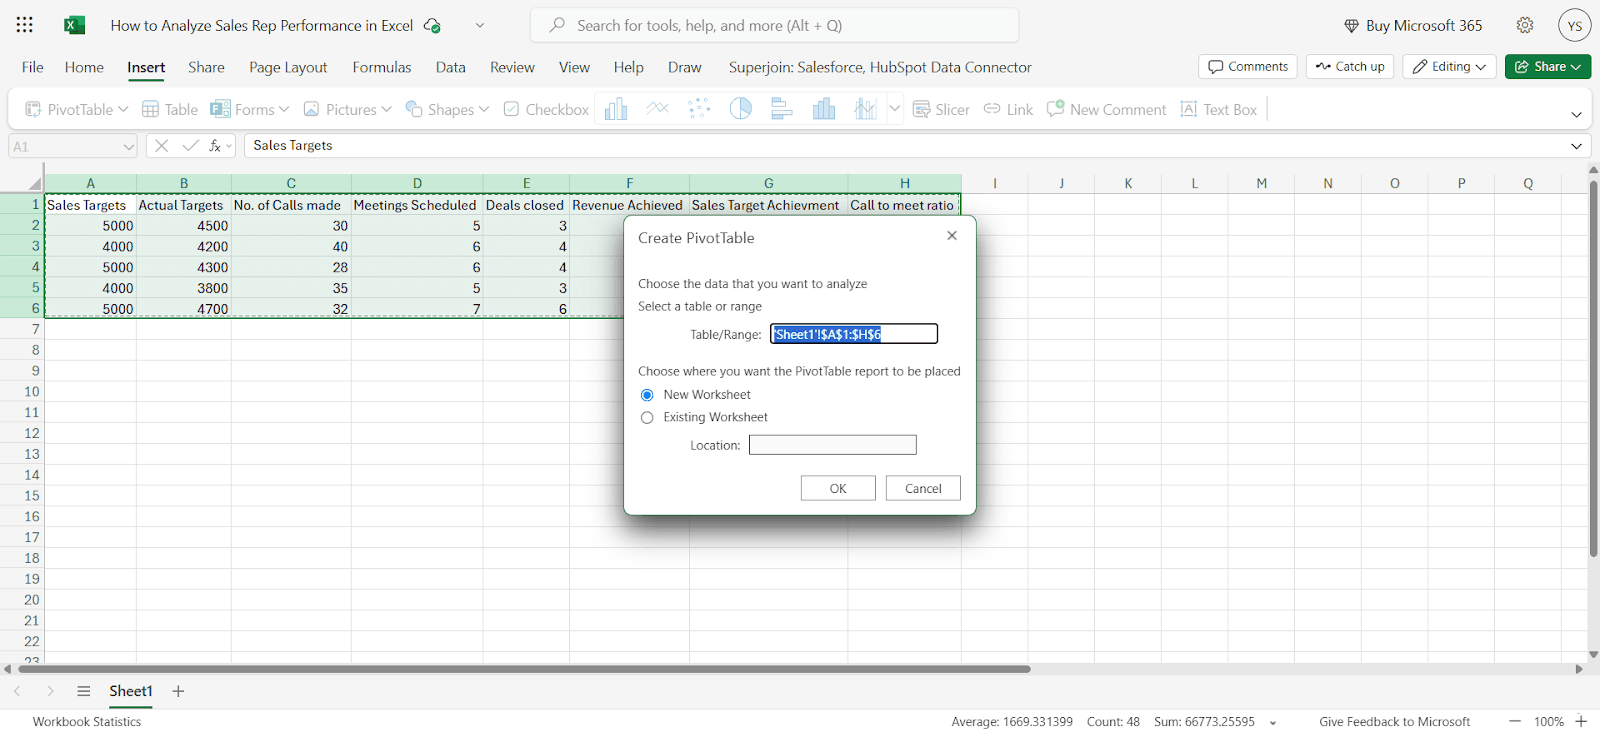
Create a Pivot Table: Go to `Insert > Pivot table.
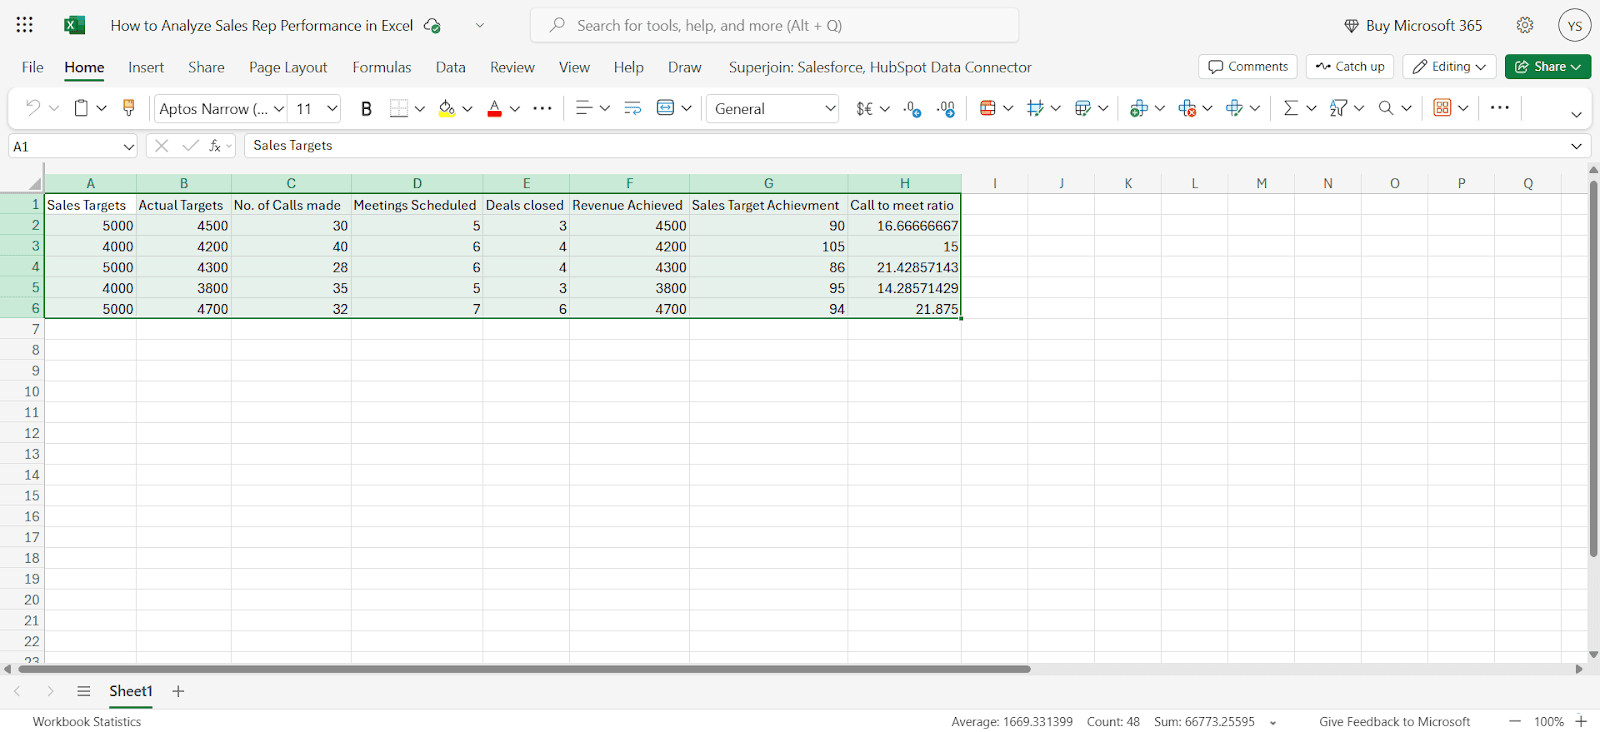
Select Data Range: Choose the range of your data.
Customise data accordingly - Here in the pivot table we can customise data based on what we want to view.

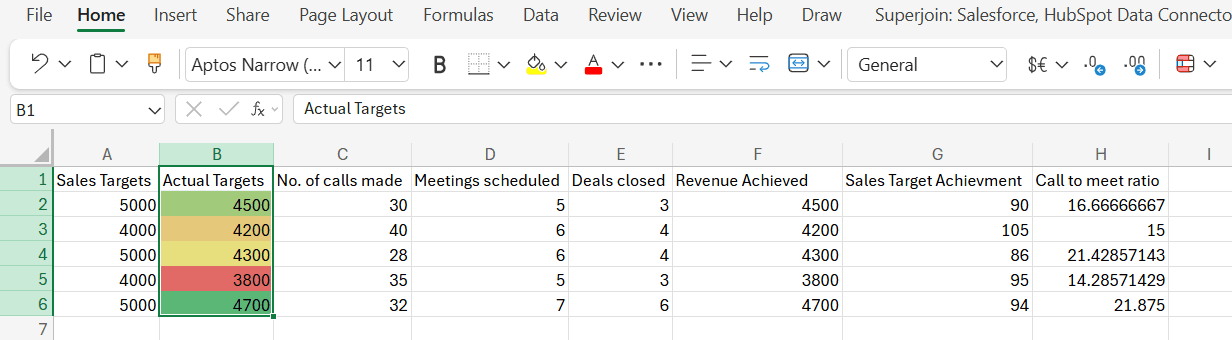
3. Conditional Formatting
Select Data Range: Highlight the cells you want to format.Set rules, such as turning cells green if the sales target achievement is over 100%.

Click on Done and see the changes made.
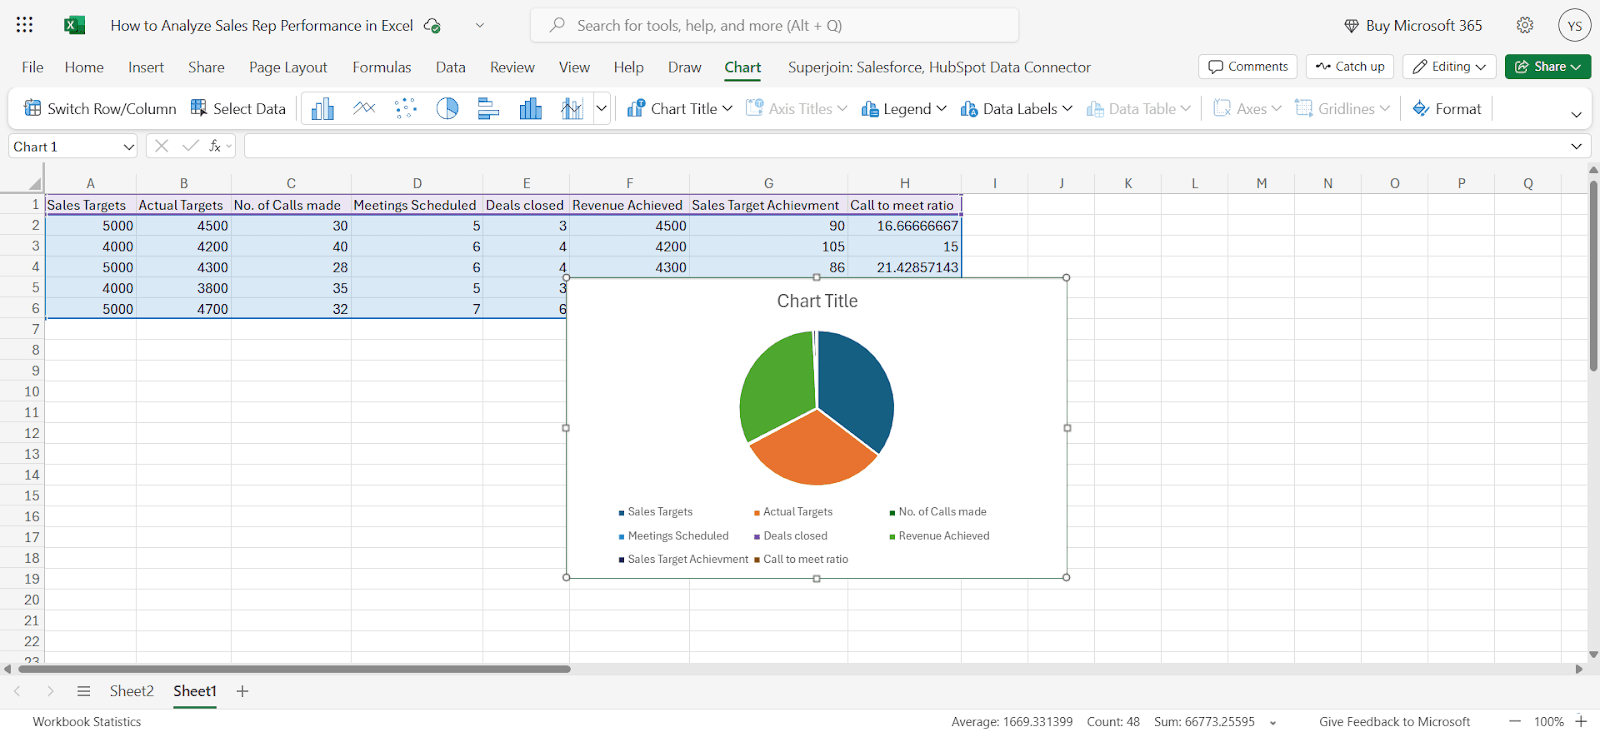
4. Visualizing Data with Charts
Visual displays can simplify complex data for better comprehension.
Step 1: Creating a Chart
Select the data you want to visualize, then go to `Insert > Chart`.

Step 2: Choosing the Right Chart
Step 3: Customizing the Chart. Use the chart editor to customize your chart’s appearance, adding titles, labels, and adjusting colors.
Advanced Analysis Techniques
1. Regression Analysis
Regression analysis is a powerful statistical method used to examine the relationship between two or more variables. In the context of sales data, it helps in predicting future sales based on historical data. Excel supports simple linear regression through the LINEST function, making it accessible for users without advanced statistical software.
The LINEST function in Excel calculates the statistics for a line by using the least squares method to fit a straight line to the given data. This equation can be utilized to forecast future values.
Example:
Suppose you have monthly sales data for the past year. By applying the LINEST function, you can identify the trend and predict next month’s sales, aiding in inventory planning and budgeting.
2. Scenario Analysis
Scenario analysis is a strategic planning method employed to create adaptable long-term plans. It involves creating and comparing different scenarios to understand the potential outcomes and impacts on your business. Excel provides a handy Scenario feature to facilitate this analysis.
By identifying key variables and creating multiple sheets for different scenarios (e.g., best-case, worst-case, and most likely case), you can visualize and compare outcomes. This helps in understanding the potential risks and rewards associated with each scenario.
Example:
If you are planning for the next fiscal year, you can use scenario analysis to project your sales under different economic conditions. This will help in making informed decisions about budgeting, staffing, and inventory management.
3. Excel Add-ins
Excel add-ins are third-party tools that enhance the functionality of Excel, enabling advanced data manipulation, analysis, and integration with other data sources. Two popular add-ins for sales data analysis are Superjoin and Excel Analytics.
Superjoin is a powerful add-in that automates data transfers from various marketing platforms into Excel. It allows you to consolidate data from multiple sources, such as Chargebee, HubSpot, etc. in one place for comprehensive analysis.
By connecting data sources, automating data transfers, and analyzing data with pivot tables, charts, and dashboards,
Example:
A marketing manager can use Superjoin to pull data from multiple platforms into Excel, creating a unified dashboard to monitor campaign performance and ROI.
Conclusion
Analyzing sales rep performance in Excel is an efficient and powerful way to gain in-depth insights into your sales team’s effectiveness. By leveraging Excel's extensive features such as formulas, pivot tables, conditional formatting, and charting capabilities, you can create comprehensive and dynamic reports.
Say Goodbye To Tedious Data Exports!
Are you tired of spending hours manually exporting CSVs from different tools and importing them into Excel?
Superjoin is a data connector for Excel that connects your favorite SaaS tools to Excel automatically. You can get data from these platforms into Excel automatically to build reports that update automatically.
Bid farewell to tedious exports and repetitive tasks. With Superjoin, you can add 1 additional day to your week. Try Superjoin for free or schedule a demo.
Sales performance analysis is crucial for understanding the effectiveness of your sales team and identifying areas for improvement. Microsoft Excel offers a robust and accessible platform for conducting detailed performance analyses without the need for expensive software. This blog will walk you through the steps to analyze sales rep performance using Microsoft Excel, providing a comprehensive guide to creating insightful and actionable reports.
Benefits of Analyzing Sales Rep Performance
Better Sales Strategies: Companies can create more successful sales strategies and procedures by knowing what makes top workers successful.
Optimized Resource Allocation: Companies can more effectively manage resources by identifying which sales representatives are performing well, guaranteeing that the most important accounts are being handled by the best representatives.
Increased Sales and income: Businesses can boost sales and income by comprehending and imitating the actions of high performers.
Improved Customer Insights: Performance analysis may show how various methods affect customer happiness and relationships, which can result in improved customer service and retention tactics.
Improved Planning and Forecasting: Performance data offers insightful information that can increase the precision of strategic planning and sales forecasting.
Finding Best Practices: By identifying the strategies and methods employed by successful sales representatives, best practices may be developed and disseminated throughout the organization.
Setting Up Your Data
Step 1: Collecting Data
Begin by gathering all relevant data. This might include:
Date
Sales rep names
Sales targets
Actual sales
Number of calls made
Meetings scheduled
Deals closed
Revenue generated
Client feedback
Step 2: Organizing Data in Excel
Install Superjoin on Microsoft Excel and data import from Hubspot. To install on Excel,
Open this link, click on Get it now.
Once installed, click on Open in Excel or Try using it online (for Excel online).
Launch Superjoin by opening the add-in and clicking on Open Sidebar. Login with your Microsoft account to start using Superjoin.
Steps Involved in Creating a Sales Dashboard
Step 1: Setting Up the Dashboard Sheet
Create a new sheet in your Excel Sheet file, named "Dashboard".
Step 2: Key Metrics Display
Display key metrics using cell references and formulas to pull data from your raw data sheet. Use functions like `AVERAGE`, `SUM`, and `COUNTIF` to calculate the overall performance metrics.
Step 3: Dynamic Filters
Add data validation and filters to allow dynamic analysis by date, sales rep, or other categories.
Analyzing Sales Data with Excel
1. Using Basic Formulas
Example 1: Calculating Sales Target Achievement
=B2/A2 * 100Drag the formula to all the cells below.This formula will calculate the sales target achievement for all rows.
Example 2: Call-to-Meeting Ratio
=D2/C2 *100Drag the formula to all the cells below.This formula will calculate the sales target achievement for all rows.
2. Pivot Tables
Pivot tables are a powerful feature in Microsoft Excel for summarizing data.
Create a Pivot Table: Go to `Insert > Pivot table.
Select Data Range: Choose the range of your data.
Customise data accordingly - Here in the pivot table we can customise data based on what we want to view.
3. Conditional Formatting
Select Data Range: Highlight the cells you want to format.Set rules, such as turning cells green if the sales target achievement is over 100%.
Click on Done and see the changes made.
4. Visualizing Data with Charts
Visual displays can simplify complex data for better comprehension.
Step 1: Creating a Chart
Select the data you want to visualize, then go to `Insert > Chart`.
Step 2: Choosing the Right Chart
Step 3: Customizing the Chart. Use the chart editor to customize your chart’s appearance, adding titles, labels, and adjusting colors.
Advanced Analysis Techniques
1. Regression Analysis
Regression analysis is a powerful statistical method used to examine the relationship between two or more variables. In the context of sales data, it helps in predicting future sales based on historical data. Excel supports simple linear regression through the LINEST function, making it accessible for users without advanced statistical software.
The LINEST function in Excel calculates the statistics for a line by using the least squares method to fit a straight line to the given data. This equation can be utilized to forecast future values.
Example:
Suppose you have monthly sales data for the past year. By applying the LINEST function, you can identify the trend and predict next month’s sales, aiding in inventory planning and budgeting.
2. Scenario Analysis
Scenario analysis is a strategic planning method employed to create adaptable long-term plans. It involves creating and comparing different scenarios to understand the potential outcomes and impacts on your business. Excel provides a handy Scenario feature to facilitate this analysis.
By identifying key variables and creating multiple sheets for different scenarios (e.g., best-case, worst-case, and most likely case), you can visualize and compare outcomes. This helps in understanding the potential risks and rewards associated with each scenario.
Example:
If you are planning for the next fiscal year, you can use scenario analysis to project your sales under different economic conditions. This will help in making informed decisions about budgeting, staffing, and inventory management.
3. Excel Add-ins
Excel add-ins are third-party tools that enhance the functionality of Excel, enabling advanced data manipulation, analysis, and integration with other data sources. Two popular add-ins for sales data analysis are Superjoin and Excel Analytics.
Superjoin is a powerful add-in that automates data transfers from various marketing platforms into Excel. It allows you to consolidate data from multiple sources, such as Chargebee, HubSpot, etc. in one place for comprehensive analysis.
By connecting data sources, automating data transfers, and analyzing data with pivot tables, charts, and dashboards,
Example:
A marketing manager can use Superjoin to pull data from multiple platforms into Excel, creating a unified dashboard to monitor campaign performance and ROI.
Conclusion
Analyzing sales rep performance in Excel is an efficient and powerful way to gain in-depth insights into your sales team’s effectiveness. By leveraging Excel's extensive features such as formulas, pivot tables, conditional formatting, and charting capabilities, you can create comprehensive and dynamic reports.
Say Goodbye To Tedious Data Exports!
Are you tired of spending hours manually exporting CSVs from different tools and importing them into Excel?
Superjoin is a data connector for Excel that connects your favorite SaaS tools to Excel automatically. You can get data from these platforms into Excel automatically to build reports that update automatically.
Bid farewell to tedious exports and repetitive tasks. With Superjoin, you can add 1 additional day to your week. Try Superjoin for free or schedule a demo.
FAQs
How can I share my sales performance analysis with my team?
How can I share my sales performance analysis with my team?
Can I automate data entry into Excel?
Can I automate data entry into Excel?
What if I need more advanced analysis than Excel can provide?
What if I need more advanced analysis than Excel can provide?
Automatic Data Pulls
Visual Data Preview
Set Alerts

Try it now