RevOps
How to Calculate and Track Sales Velocity Over Time in Google Sheets
Calculate and track sales velocity in Google Sheets. Step-by-step guide to monitor and improve sales performance.
Table of Contents
How to Calculate and Track Sales Velocity Over Time in Google Sheets
Learn how to calculate and track sales velocity over time in Google Sheets. Discover effective methods to monitor and improve your sales performance with detailed step-by-step instructions.
In the fast-paced world of sales, understanding your momentum is crucial. Just like a speeding car, your sales pipeline needs to maintain velocity to achieve your goals. But how do you measure that velocity? Enter the powerful metric – Sales Velocity.
This blog will equip you with the knowledge to calculate and track your sales velocity over time using the readily available Google Sheets. We'll delve into the concept of sales velocity, guide you through setting up your Google Sheet, and explore how to leverage this data for informed sales decisions.
What is Sales Velocity?
Sales velocity is a metric in sales that measures how quickly deals move through your sales pipeline and generate revenue. In simpler terms, it's a way to gauge how fast your sales team is closing deals and bringing in money.
Imagine a conveyor belt where leads enter at one end, progress through various stages of qualification and negotiation, and finally emerge as paying customers at the other end. Sales velocity reflects the speed at which these deals travel through the conveyor belt. A high sales velocity indicates a smooth-running sales process that efficiently converts leads into customers.
By consistently tracking your sales velocity in Google Sheets, you gain valuable insights into your sales pipeline's health. Use this data to identify areas for improvement, optimize your sales process, and ultimately achieve your revenue goals. Remember, a high and consistent sales velocity is a powerful indicator that your sales engine is firing on all cylinders, propelling your business toward continued growth.
Here's the formula to calculate Sales Velocity:
For example, if you closed deals worth $100,000 in a month and your average sales cycle is 30 days, your sales velocity would be $3,333.33 per day.
Why is Sales Velocity Important?
Sales velocity offers valuable insights into your sales team's performance. It helps you:
Forecast Revenue: By analyzing past velocity, you can estimate future revenue with greater accuracy.
Identify Bottlenecks: A declining velocity can indicate inefficiencies in your sales process. You can then identify areas that need improvement.
Optimize Sales Resources: Allocate resources strategically based on the velocity at different stages of the pipeline.
Deal Weighting: Not all deals are created equal. Consider weighting deals based on their size or importance to get a more accurate picture of your overall sales momentum. You can achieve this by incorporating a "Deal Weight" column and multiplying it by the Deal Value in the Sales Velocity formula.
Time Period: The time period you choose for calculating sales velocity can significantly impact the result. Analyze velocity for shorter periods (weekly, monthly) to identify trends and fluctuations that might get obscured in a longer timeframe.
Predictive Power: Sales velocity is not just a lagging indicator of past performance. By analyzing trends and historical data, you can use sales velocity to make informed predictions about future revenue growth. This allows for proactive adjustments to your sales strategy and resource allocation.
Steps to Calculate and Track Sales Velocity
There are three ways to get data for your report:
Search for specific data using a SOQL Lookup.
Use the information from an existing report as a springboard for your own analysis.
Pick the objects and specific fields you want to include.
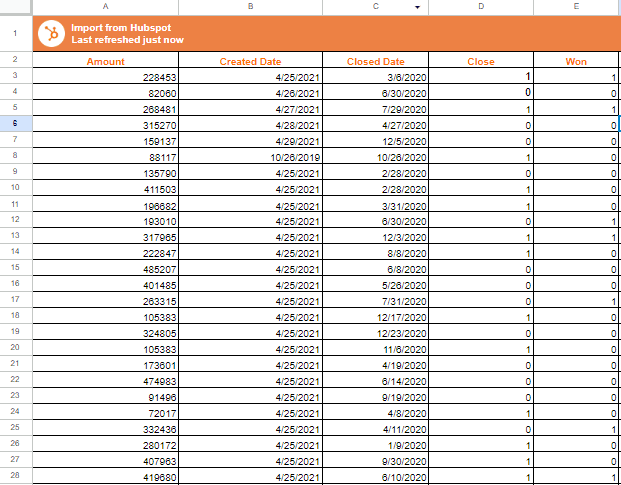
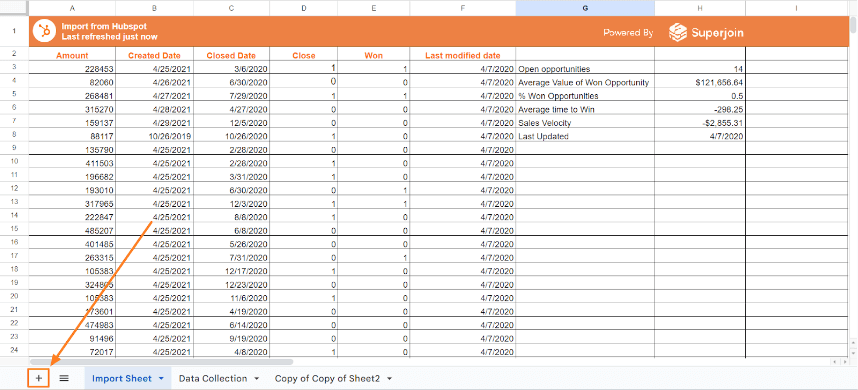
We already have an existing report in HubSpot that can be used for dashboards. Let's access it and analyze the data. For detailed instructions on connecting HubSpot to Google Sheets, you can check out our blog post.
Step 1: Schedule Automatic Data Refreshes
Superjoin allows you to schedule automatic data refreshes. In your Superjoin add-on, find the "Refresh" menu and click the options available there.
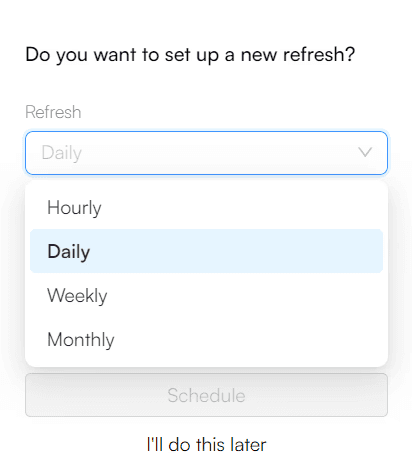
Step 2: Choose the refresh frequency (Hourly, Daily, Weekly, Monthly) and set the specific time.
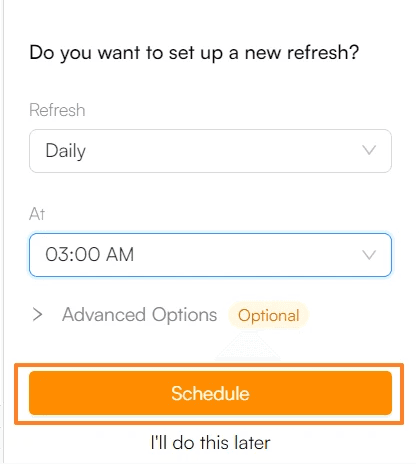
Step 3: Click on “Schedule”.
By capturing our data each month, we can create a record of our sales performance over time. This will allow us to track how quickly our sales are moving (sales velocity).
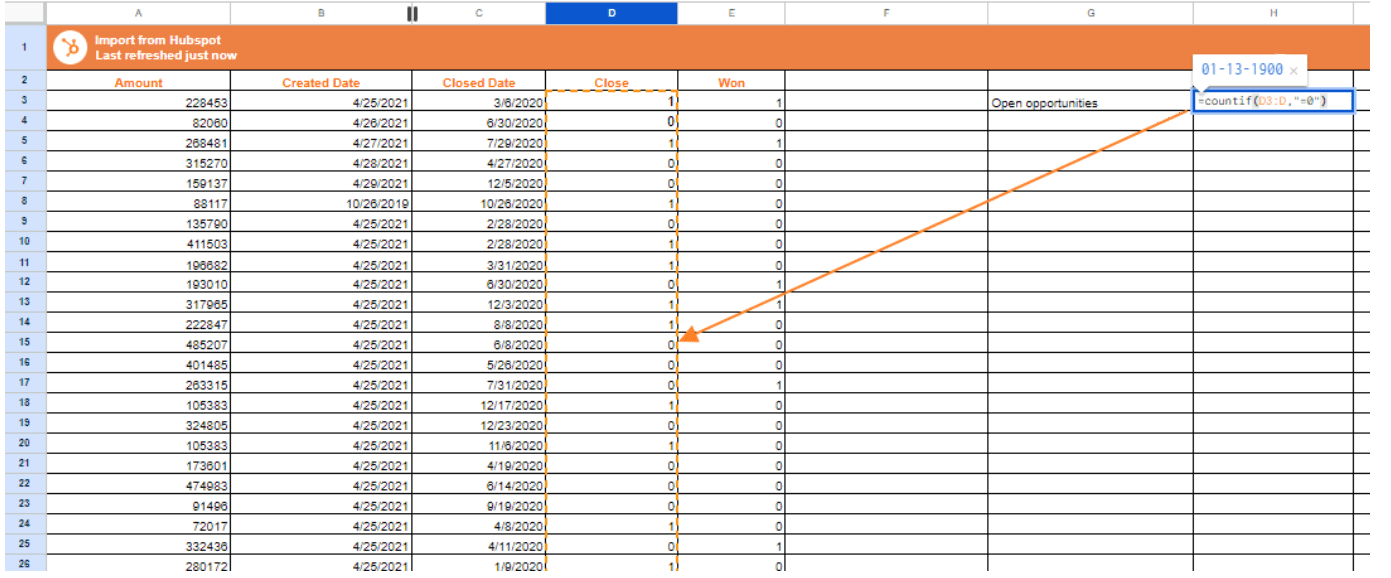
Step 4: In the cell next to "Open Opportunities," enter the formula shown below.
=COUNTIF(D3:D,“=0”)
In this case, the formula counts rows where the value in the "Closed" column is 0 (assuming 0 represents an open opportunity).
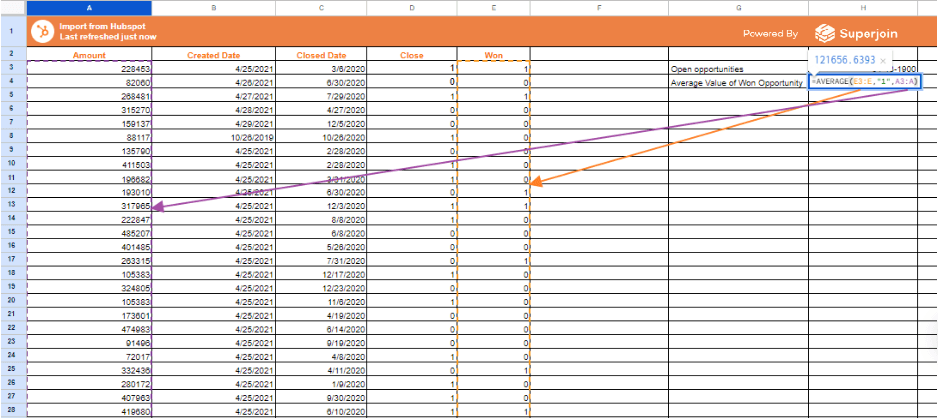
Step 5: Calculating the Average Value of a Won Opportunity
Identify the Cell: Locate the cell next to the "Open Opportunities."
Enter the Formula: Input the formula provided below:
=AVERAGEIF(E3:E,“=1”,A3:A)
3. Understand the Formula: The AVERAGEIF function calculates the average of values in a specific range that meet a certain condition.
Range for Condition: Define the range of cells in the "Won" column (E3:E).
Condition: Specify the condition that the value in the "Won" column must be exactly 1 (representing won opportunities).
Range for Values: Specify the range containing the actual won amounts (A3:A).
4. Apply the Formula: This formula will calculate the average amount won on deals, considering only the "Won" opportunities.
Step 6: Adjusting the Method for Tracking Won Opportunities
Track Win Rate: Calculate the win rate using the formula below:
=COUNTIF(E3:E,“=1”)/COUNTIF(D3:D,“=1”)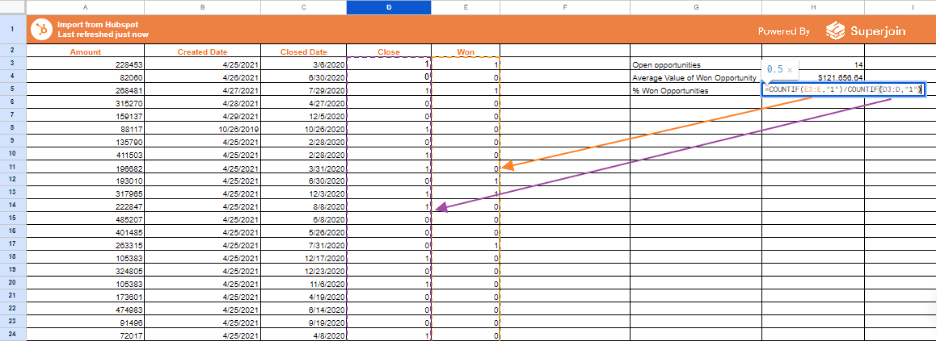
2. Formula Explanation:
COUNTIF for Won Opportunities: Count the number of won opportunities (E3:E) where the value is 1.
COUNTIF for Closed Opportunities: Count the total number of closed opportunities (D3:D) where the value is 1.
Calculate Win Rate: Divide the number of won opportunities by the total number of closed opportunities.
3. Result: This will give you the win rate as a percentage.
Step 7: Calculating Average Time to Win
Identify the Cells: Utilize the existing date fields to calculate the average time to win.
Enter the Formula:
=AVERAGEIF(E3:E,“=1”,C3:C)-AVERAGEIF(E3:E,“=1”,B3:B)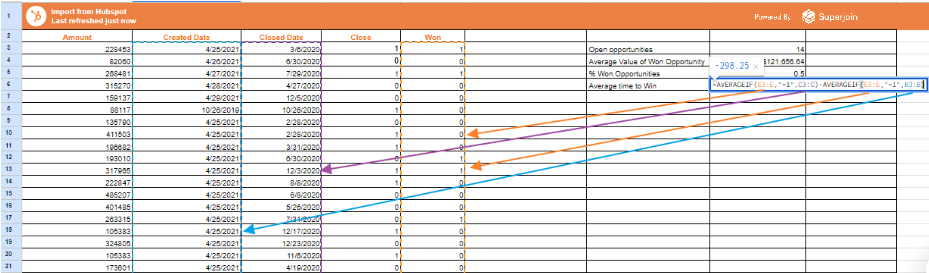
3. Formula Explanation:
AVERAGEIF for Close Dates: Calculate the average close date (C3:C) for won opportunities.
AVERAGEIF for Start Dates: Calculate the average start date (B3:B) for won opportunities.
Calculate Average Time to Win: Subtract the average start date from the average close date.
4. Result: This formula calculates the average time an opportunity spends in progress without needing a separate "Time to Close" field.
Step 8: Calculating Sales Velocity
1. Sales Velocity Formula:
2. In Google Sheets:
=H3*H4*H5/H6
3. Explanation:
H3: Total Value of Closed Deals.
H4: Number of Deals.
H5: Average Deal Size.
H6: Average Sales Cycle Length.
4. Result: This formula calculates the sales velocity.
We've successfully calculated our sales velocity!
Here's an exciting bonus: Since Superjoin can automatically capture snapshots of our data, the formulas we used will be applied to every new snapshot, essentially updating themselves. This means minimal effort is needed to maintain a line graph showing how the data evolves over time.
To automate the X-axis, we'll simply add the "Last Modified Date" to our report and include it in the data pulled by Superjoin. Then, by using the MAX function on all the "Last Modified Dates," we can automatically populate the X-axis values, ensuring the graph reflects the most recent data point.
Step 9: Automating the X-Axis for Sales Velocity Tracking
Add "Last Modified Date": Include the "Last Modified Date" in your report.
Use the MAX Function:
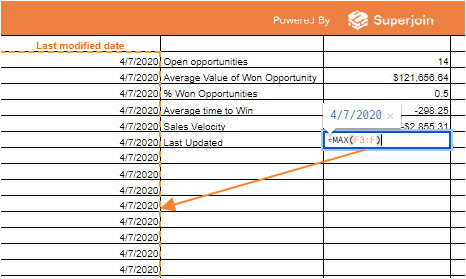
Once the report refreshes, the "Last Modified" dates for both the report itself and the individual snapshots will update automatically. This is because the snapshots capture the data state at a specific point, ensuring the "Last Updated" date on the dashboard reflects the most recent data. Now we're ready to build our dashboard! We'll create a line graph that tracks the exciting new metric - Sales Velocity - over time.
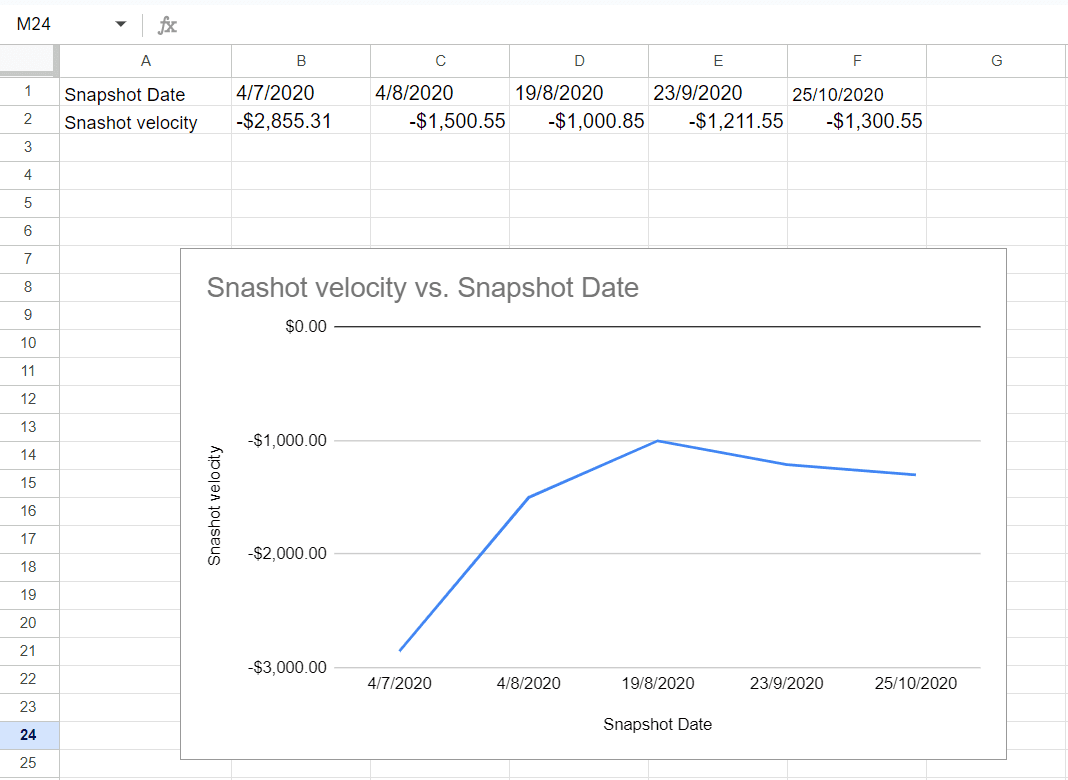
Step 10: Creating a Chart
Add a new sheet: In your Google Sheet, create a new sheet to store your data.
Include date cells: In this new sheet, add cells for the snapshot dates. You'll need one cell for the initial import date and additional cells for each future snapshot. You can use the formula given below to import the Snapshot Date from the Import sheet.
='Import Sheet'!H8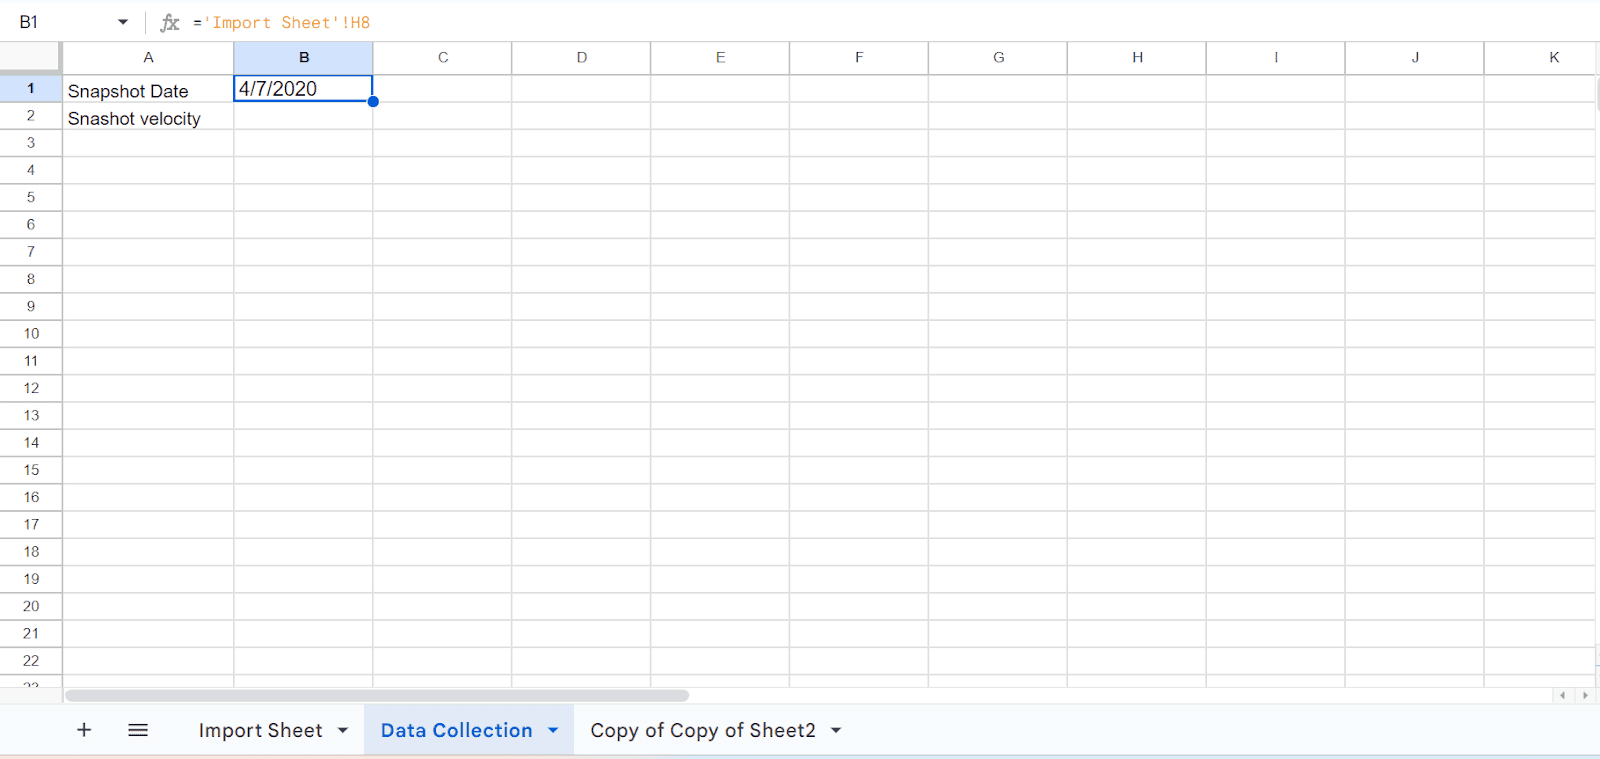
Link dates for new snapshots: When adding a new snapshot, insert a new column next to the existing data. In the header row of this new column, enter the date for this snapshot. Then, link the date cell in this new column back to the corresponding snapshot data (explained in the original text). This will keep your data organized and allow easy tracking of changes over time.
Do the same for Sales Velocity.
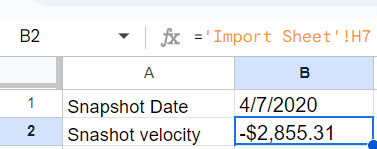
By gathering a few key pieces of information, you'll be able to quickly visualize your sales velocity and empower your team to optimize their performance.
Conclusion
Sales velocity is a vital metric for understanding how quickly your sales team converts leads into revenue. By tracking it over time in Google Sheets, you gain valuable insights into your sales pipeline's health and identify areas for improvement.
This guide has equipped you with the tools to calculate both "Average Time to Win" and track overall sales velocity trends. Remember, a well-functioning sales pipeline should see both a healthy win rate and a decreasing average time to win deals.
The flexibility of Google Sheets is one of its greatest strengths. As your needs evolve, you can easily adapt your formulas and charts to incorporate additional sales data or analyze specific segments within your sales team. With consistent data collection and analysis, your Google Sheet will become a powerful tool for monitoring your sales engine and driving growth.
So don't wait! Start tracking your sales velocity today and unlock the potential for a faster, more efficient sales process.
Say Goodbye to Tedious Data Exports! 🚀
Are you tired of spending hours manually exporting CSVs from different tools and importing them into Google Sheets?
Superjoin is a data connector for Google Sheets that connects your favorite SaaS tools to Google Sheets automatically. You can get data from these platforms into Google Sheets automatically to build reports that update automatically.
Bid farewell to tedious exports and repetitive tasks. With Superjoin, you can add 1 additional day to your week. Try Superjoin out for free or schedule a demo.
How to Calculate and Track Sales Velocity Over Time in Google Sheets
Learn how to calculate and track sales velocity over time in Google Sheets. Discover effective methods to monitor and improve your sales performance with detailed step-by-step instructions.
In the fast-paced world of sales, understanding your momentum is crucial. Just like a speeding car, your sales pipeline needs to maintain velocity to achieve your goals. But how do you measure that velocity? Enter the powerful metric – Sales Velocity.
This blog will equip you with the knowledge to calculate and track your sales velocity over time using the readily available Google Sheets. We'll delve into the concept of sales velocity, guide you through setting up your Google Sheet, and explore how to leverage this data for informed sales decisions.
What is Sales Velocity?
Sales velocity is a metric in sales that measures how quickly deals move through your sales pipeline and generate revenue. In simpler terms, it's a way to gauge how fast your sales team is closing deals and bringing in money.
Imagine a conveyor belt where leads enter at one end, progress through various stages of qualification and negotiation, and finally emerge as paying customers at the other end. Sales velocity reflects the speed at which these deals travel through the conveyor belt. A high sales velocity indicates a smooth-running sales process that efficiently converts leads into customers.
By consistently tracking your sales velocity in Google Sheets, you gain valuable insights into your sales pipeline's health. Use this data to identify areas for improvement, optimize your sales process, and ultimately achieve your revenue goals. Remember, a high and consistent sales velocity is a powerful indicator that your sales engine is firing on all cylinders, propelling your business toward continued growth.
Here's the formula to calculate Sales Velocity:
For example, if you closed deals worth $100,000 in a month and your average sales cycle is 30 days, your sales velocity would be $3,333.33 per day.
Why is Sales Velocity Important?
Sales velocity offers valuable insights into your sales team's performance. It helps you:
Forecast Revenue: By analyzing past velocity, you can estimate future revenue with greater accuracy.
Identify Bottlenecks: A declining velocity can indicate inefficiencies in your sales process. You can then identify areas that need improvement.
Optimize Sales Resources: Allocate resources strategically based on the velocity at different stages of the pipeline.
Deal Weighting: Not all deals are created equal. Consider weighting deals based on their size or importance to get a more accurate picture of your overall sales momentum. You can achieve this by incorporating a "Deal Weight" column and multiplying it by the Deal Value in the Sales Velocity formula.
Time Period: The time period you choose for calculating sales velocity can significantly impact the result. Analyze velocity for shorter periods (weekly, monthly) to identify trends and fluctuations that might get obscured in a longer timeframe.
Predictive Power: Sales velocity is not just a lagging indicator of past performance. By analyzing trends and historical data, you can use sales velocity to make informed predictions about future revenue growth. This allows for proactive adjustments to your sales strategy and resource allocation.
Steps to Calculate and Track Sales Velocity
There are three ways to get data for your report:
Search for specific data using a SOQL Lookup.
Use the information from an existing report as a springboard for your own analysis.
Pick the objects and specific fields you want to include.
We already have an existing report in HubSpot that can be used for dashboards. Let's access it and analyze the data. For detailed instructions on connecting HubSpot to Google Sheets, you can check out our blog post.
Step 1: Schedule Automatic Data Refreshes
Superjoin allows you to schedule automatic data refreshes. In your Superjoin add-on, find the "Refresh" menu and click the options available there.
Step 2: Choose the refresh frequency (Hourly, Daily, Weekly, Monthly) and set the specific time.
Step 3: Click on “Schedule”.
By capturing our data each month, we can create a record of our sales performance over time. This will allow us to track how quickly our sales are moving (sales velocity).
Step 4: In the cell next to "Open Opportunities," enter the formula shown below.
=COUNTIF(D3:D,“=0”)
In this case, the formula counts rows where the value in the "Closed" column is 0 (assuming 0 represents an open opportunity).
Step 5: Calculating the Average Value of a Won Opportunity
Identify the Cell: Locate the cell next to the "Open Opportunities."
Enter the Formula: Input the formula provided below:
=AVERAGEIF(E3:E,“=1”,A3:A)
3. Understand the Formula: The AVERAGEIF function calculates the average of values in a specific range that meet a certain condition.
Range for Condition: Define the range of cells in the "Won" column (E3:E).
Condition: Specify the condition that the value in the "Won" column must be exactly 1 (representing won opportunities).
Range for Values: Specify the range containing the actual won amounts (A3:A).
4. Apply the Formula: This formula will calculate the average amount won on deals, considering only the "Won" opportunities.
Step 6: Adjusting the Method for Tracking Won Opportunities
Track Win Rate: Calculate the win rate using the formula below:
=COUNTIF(E3:E,“=1”)/COUNTIF(D3:D,“=1”)
2. Formula Explanation:
COUNTIF for Won Opportunities: Count the number of won opportunities (E3:E) where the value is 1.
COUNTIF for Closed Opportunities: Count the total number of closed opportunities (D3:D) where the value is 1.
Calculate Win Rate: Divide the number of won opportunities by the total number of closed opportunities.
3. Result: This will give you the win rate as a percentage.
Step 7: Calculating Average Time to Win
Identify the Cells: Utilize the existing date fields to calculate the average time to win.
Enter the Formula:
=AVERAGEIF(E3:E,“=1”,C3:C)-AVERAGEIF(E3:E,“=1”,B3:B)
3. Formula Explanation:
AVERAGEIF for Close Dates: Calculate the average close date (C3:C) for won opportunities.
AVERAGEIF for Start Dates: Calculate the average start date (B3:B) for won opportunities.
Calculate Average Time to Win: Subtract the average start date from the average close date.
4. Result: This formula calculates the average time an opportunity spends in progress without needing a separate "Time to Close" field.
Step 8: Calculating Sales Velocity
1. Sales Velocity Formula:
2. In Google Sheets:
=H3*H4*H5/H6
3. Explanation:
H3: Total Value of Closed Deals.
H4: Number of Deals.
H5: Average Deal Size.
H6: Average Sales Cycle Length.
4. Result: This formula calculates the sales velocity.
We've successfully calculated our sales velocity!
Here's an exciting bonus: Since Superjoin can automatically capture snapshots of our data, the formulas we used will be applied to every new snapshot, essentially updating themselves. This means minimal effort is needed to maintain a line graph showing how the data evolves over time.
To automate the X-axis, we'll simply add the "Last Modified Date" to our report and include it in the data pulled by Superjoin. Then, by using the MAX function on all the "Last Modified Dates," we can automatically populate the X-axis values, ensuring the graph reflects the most recent data point.
Step 9: Automating the X-Axis for Sales Velocity Tracking
Add "Last Modified Date": Include the "Last Modified Date" in your report.
Use the MAX Function:
Once the report refreshes, the "Last Modified" dates for both the report itself and the individual snapshots will update automatically. This is because the snapshots capture the data state at a specific point, ensuring the "Last Updated" date on the dashboard reflects the most recent data. Now we're ready to build our dashboard! We'll create a line graph that tracks the exciting new metric - Sales Velocity - over time.
Step 10: Creating a Chart
Add a new sheet: In your Google Sheet, create a new sheet to store your data.
Include date cells: In this new sheet, add cells for the snapshot dates. You'll need one cell for the initial import date and additional cells for each future snapshot. You can use the formula given below to import the Snapshot Date from the Import sheet.
='Import Sheet'!H8Link dates for new snapshots: When adding a new snapshot, insert a new column next to the existing data. In the header row of this new column, enter the date for this snapshot. Then, link the date cell in this new column back to the corresponding snapshot data (explained in the original text). This will keep your data organized and allow easy tracking of changes over time.
Do the same for Sales Velocity.
By gathering a few key pieces of information, you'll be able to quickly visualize your sales velocity and empower your team to optimize their performance.
Conclusion
Sales velocity is a vital metric for understanding how quickly your sales team converts leads into revenue. By tracking it over time in Google Sheets, you gain valuable insights into your sales pipeline's health and identify areas for improvement.
This guide has equipped you with the tools to calculate both "Average Time to Win" and track overall sales velocity trends. Remember, a well-functioning sales pipeline should see both a healthy win rate and a decreasing average time to win deals.
The flexibility of Google Sheets is one of its greatest strengths. As your needs evolve, you can easily adapt your formulas and charts to incorporate additional sales data or analyze specific segments within your sales team. With consistent data collection and analysis, your Google Sheet will become a powerful tool for monitoring your sales engine and driving growth.
So don't wait! Start tracking your sales velocity today and unlock the potential for a faster, more efficient sales process.
Say Goodbye to Tedious Data Exports! 🚀
Are you tired of spending hours manually exporting CSVs from different tools and importing them into Google Sheets?
Superjoin is a data connector for Google Sheets that connects your favorite SaaS tools to Google Sheets automatically. You can get data from these platforms into Google Sheets automatically to build reports that update automatically.
Bid farewell to tedious exports and repetitive tasks. With Superjoin, you can add 1 additional day to your week. Try Superjoin out for free or schedule a demo.
FAQs
Is "Average Time to Win" the same as "Sales Cycle Length"?
Is "Average Time to Win" the same as "Sales Cycle Length"?
Are there any limitations to tracking sales velocity in Google Sheets?
Are there any limitations to tracking sales velocity in Google Sheets?
How can I segment my sales velocity data?
How can I segment my sales velocity data?
Automatic Data Pulls
Visual Data Preview
Set Alerts

Try it now