RevOps
How To Create a Sales Pipeline on Excel
Master your sales with a Microsoft Excel sales pipeline template! Easily track leads, deals, and progress.
Table of Contents
A clear funnel is essential to the success of any sales team. It gives you a clear picture of prospective sales, how they are progressing through the sales cycle, and, in the end, how well your income stream is doing. However, running a complicated pipeline can be difficult, particularly for startups or smaller companies.
Excel is useful in this situation. Excel provides an excellent basis for creating a personalized sales pipeline tracker, and it is a freely downloadable tool. In this blog, we'll walk you through the steps of building your own tracker and show you how to use Superjoin, a robust Excel add-in, to further improve the functionality of your pipeline.
Why Use Microsoft Excel for Your Sales Pipeline?
Here's why Excel is a great option for building your sales pipeline tracker:
Free and Accessible: Excel is accessible and free, making it an affordable option for companies of all sizes.
Collaborative: Transparency and real-time communication are promoted by the tracker's simultaneous access and updating by several team members.
Customizable: You can modify the tracker to meet your unique data requirements and sales process.
Things to Consider before Building Your Sales Pipeline Tracker
Let's get started! Here's a breakdown of the steps involved:
Step 1. Define Your Sales Stages
The first step is to identify the distinct stages your prospects go through in your sales cycle. Common examples include:
Lead Generation - Identifying potential customers.
Qualification - Assessing a lead's fit for your product or service.
Proposal/Quote - Presenting your offer to the qualified lead.
Negotiation - Discussing terms and pricing.
Closed Won/Lost - The final outcome of the sales process.
Step 2. Design Your Spreadsheet
Open a new Excel Sheet and create a clear layout for your tracker. Let's cover some important aspects to consider:
Columns:
Prospect Name: Company or individual name.
Contact Information: Name, email, phone number.
Sales Stage: Dropdown menu or a designated column for each stage.
Deal Value: Estimated value of the sale.
Close Date: Target date for closing the deal.
Sales Rep: Assigned salesperson (optional).
Additional Columns: You can include custom columns depending on your needs, such as "Notes," "Next Steps," or "Competitors."
Rows:
Each row represents a potential deal.
Step 3. Populate Your Tracker
Start by adding leads and their details to the relevant columns. Utilize conditional formatting to visually differentiate based on the sales stage (e.g., color-code each stage).
Step 4. Formulas and Functions
Leverage Excel's built-in formulas to automate calculations and gain valuable insights. Here are some examples:
SUMIFS: Calculate the total potential revenue in each sales stage.
COUNTIFS: Track the number of deals at different stages.
VLOOKUP: Automatically populate data from other sheets within your workbook.
Step 5. Charts and Dashboards
Visualize your sales pipeline with charts and graphs. Excel offers a variety of options, including bar charts, pie charts, and line graphs. Create insightful dashboards to monitor key metrics and identify trends, like conversion rates or average deal size by stage.
Supercharge Your Sales Pipeline Template Excel with Superjoin
While Excel provides a solid foundation, Superjoin takes your sales pipeline tracker to the next level. Superjoin is a powerful Excel connector that unlocks a plethora of features to streamline your sales process and boost efficiency.
Automated Workflows: Simplify repetitive tasks with automated workflows. Set up triggers that automatically update stages, send email notifications, or assign tasks based on specific criteria.
A Step-by-Step Guide to Create a Sales Pipeline in Excel using Hubspot Data
HubSpot empowers businesses to cultivate strong customer relationships through centralized contact and deal management. But sometimes, you might need to analyze your data in a different format, like the familiar and versatile world of Excel.
HubSpot's default reporting system lacks built-in scheduling for exports. This means manually exporting reports at regular intervals and relying on email reminders for new data. This approach can be inefficient and lead to outdated information.
Superjoin offers a solution to automate HubSpot report exports to Excel. Here's how it works:
A. Install Superjoin
Install Superjoin on Microsoft Excel
Step 1: Open this link, click on Get it now.
Once installed, click on Open in Excel or Try using it online (for Excel online).
Step 2: Launch Superjoin by opening the add-in and clicking on Open Sidebar. Login with your Microsoft account to start using Superjoin.
B. Connect Hubspot
Step 1: Select HubSpot as the Data Source
Click on Sources. Choose HubSpot as the data source.
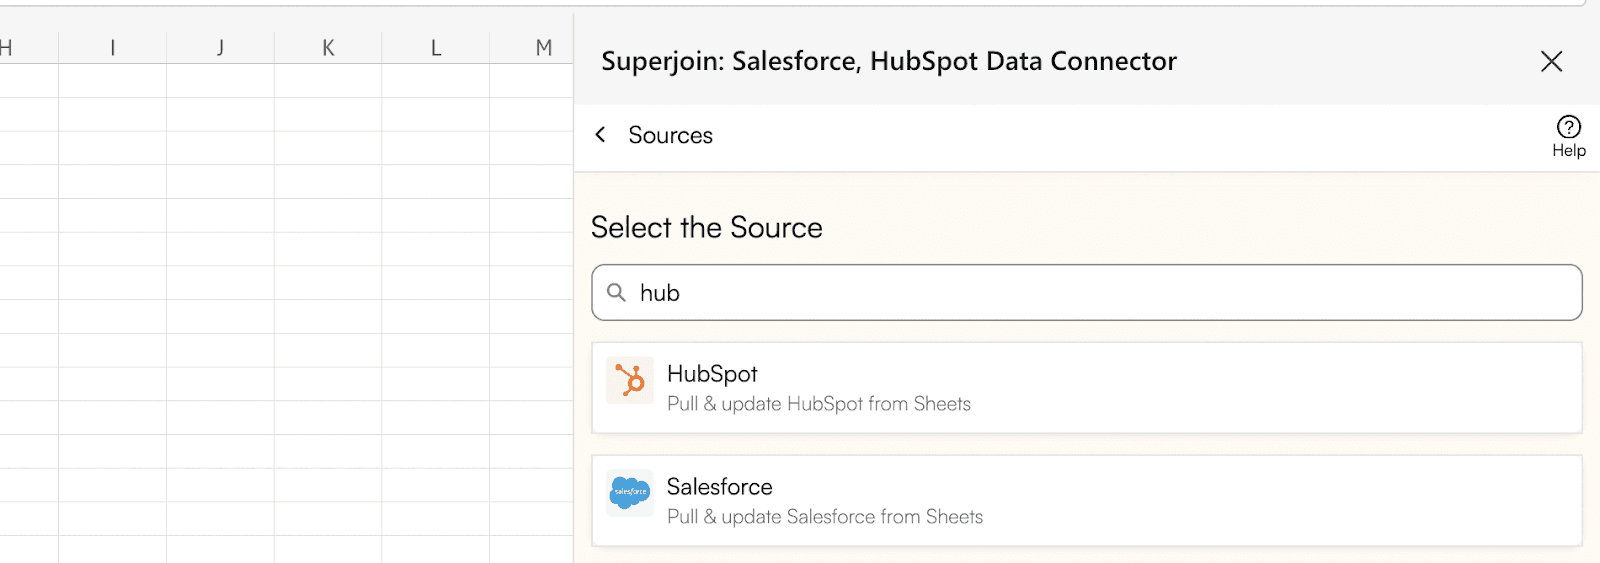
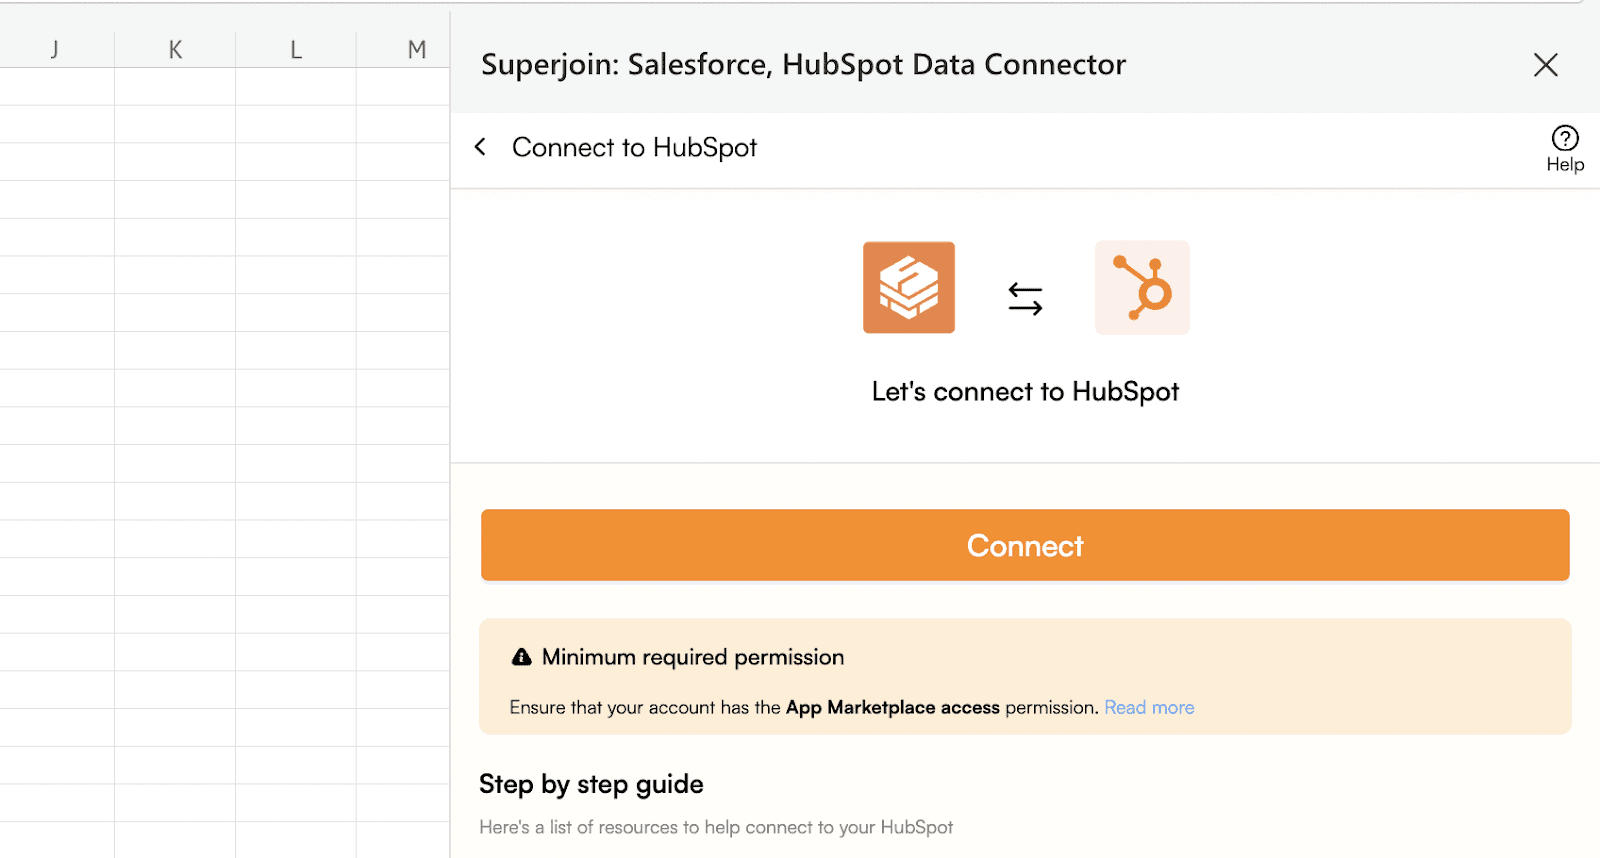
Click on Connect to connect to your HubSpot account and follow the on-screen instructions.
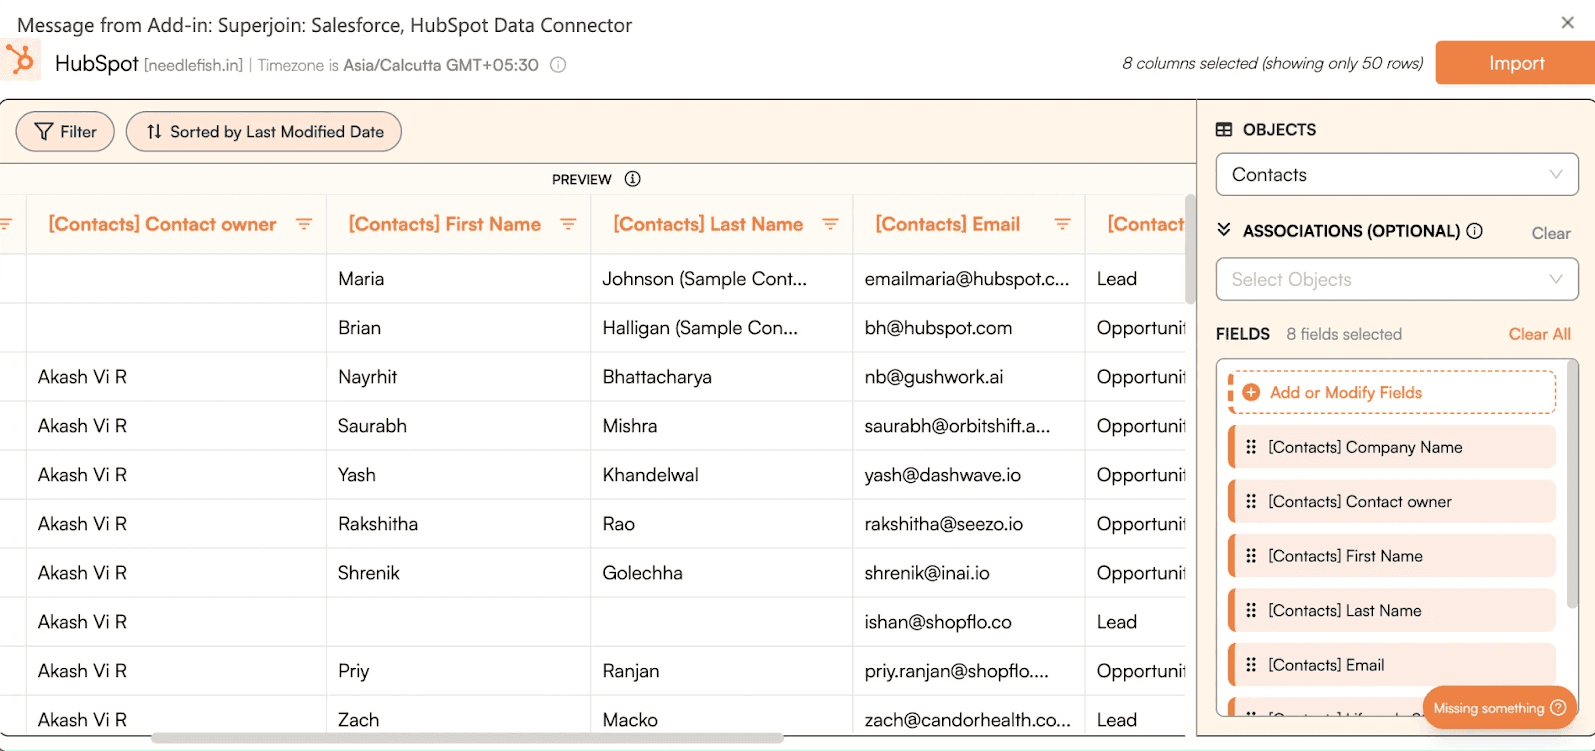
Step 2: Import Data from HubSpot to Microsoft Excel
Select the data objects you want to import from HubSpot, such as Deals, Contacts, or other relevant information, and click on Import.
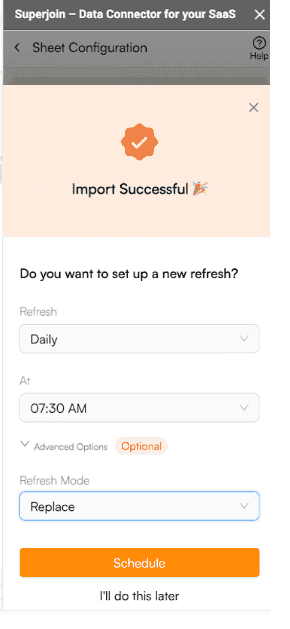
Step 3: Set Up Automatic Sync
Set up automatic sync between HubSpot and Microsoft Excel. Set it to auto-refresh on a schedule
Sales Pipeline Stages
Let's define the typical stages in a sales pipeline:
Lead: Initial contact with a potential customer.
Qualified Lead: Lead has been qualified based on certain criteria.
Proposal Sent: A proposal or quote has been sent to the potential customer.
Negotiation: Ongoing discussions and negotiations with the potential customer.
Closed Won: Sale has been successfully completed.
Closed Lost: Lead did not result in a sale.
How To Build Your Sales Pipeline Tracker
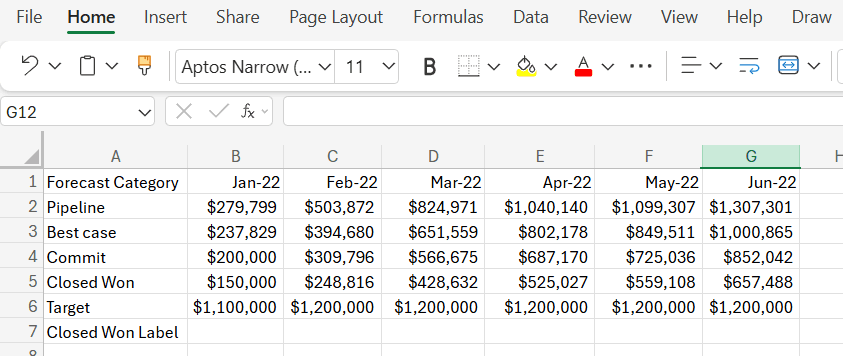
In your Excel spreadsheet, create a new sheet to track your sales pipeline. Use data from your HubSpot import, with "Forecast Category" in the first column and months listed across the top row.
Applying the First Formula:
=iferror(INDEX('Opportunity'!$A$3:$M$7,match($B3,'Opportunity'!$A$3:$A$7,0),match(C$2,'Opportunity'!$A$3:$M$3,0)),)Formula Explanation:
This formula uses INDEX and MATCH functions to look up the value from the Opportunity sheet.
INDEX(‘Opportunity’!$A$3:$M$7, finds the correct value within the specified range.
MATCH($B3,’Opportunity’!$A$3:$A$7,0) matches the forecast category.
MATCH(C$2,’Opportunity’!$A$3:$M$3,0) matches the month.
IFERROR is used to handle any errors that might arise from mismatches.
Select cell B3.
Drag the formula across the row to fill in the values for each month.
Then, drag down to fill in for each forecast category.
2. Applying the Second Formula for Closed Won:
=IF(MAX(‘Opportunity’!$B$3:$M$3)=C$7, TEXT(C$11, "$#,##0.0,K"), "")Formula Explanation:
This formula checks if the maximum value in the month row from the Opportunity sheet matches the current month in the target sheet.
If it matches, it formats the value in C$11 as currency.
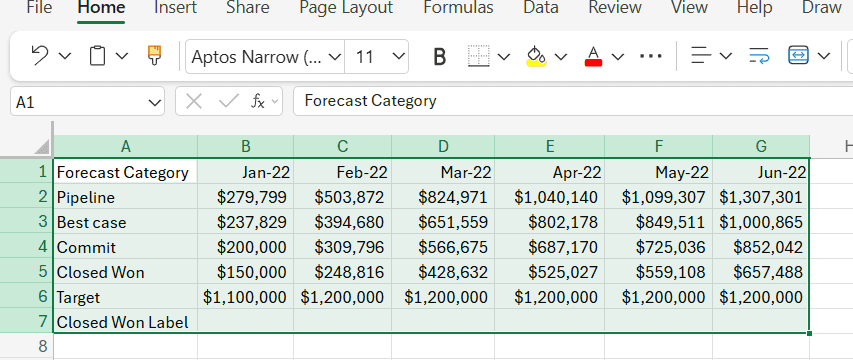
3. Enter the above formula in the appropriate cell where you want to calculate the "Closed Won" label:
Highlight the cell that holds the formula you entered.
Drag the formula across the row to apply it to each month.
Creating Charts
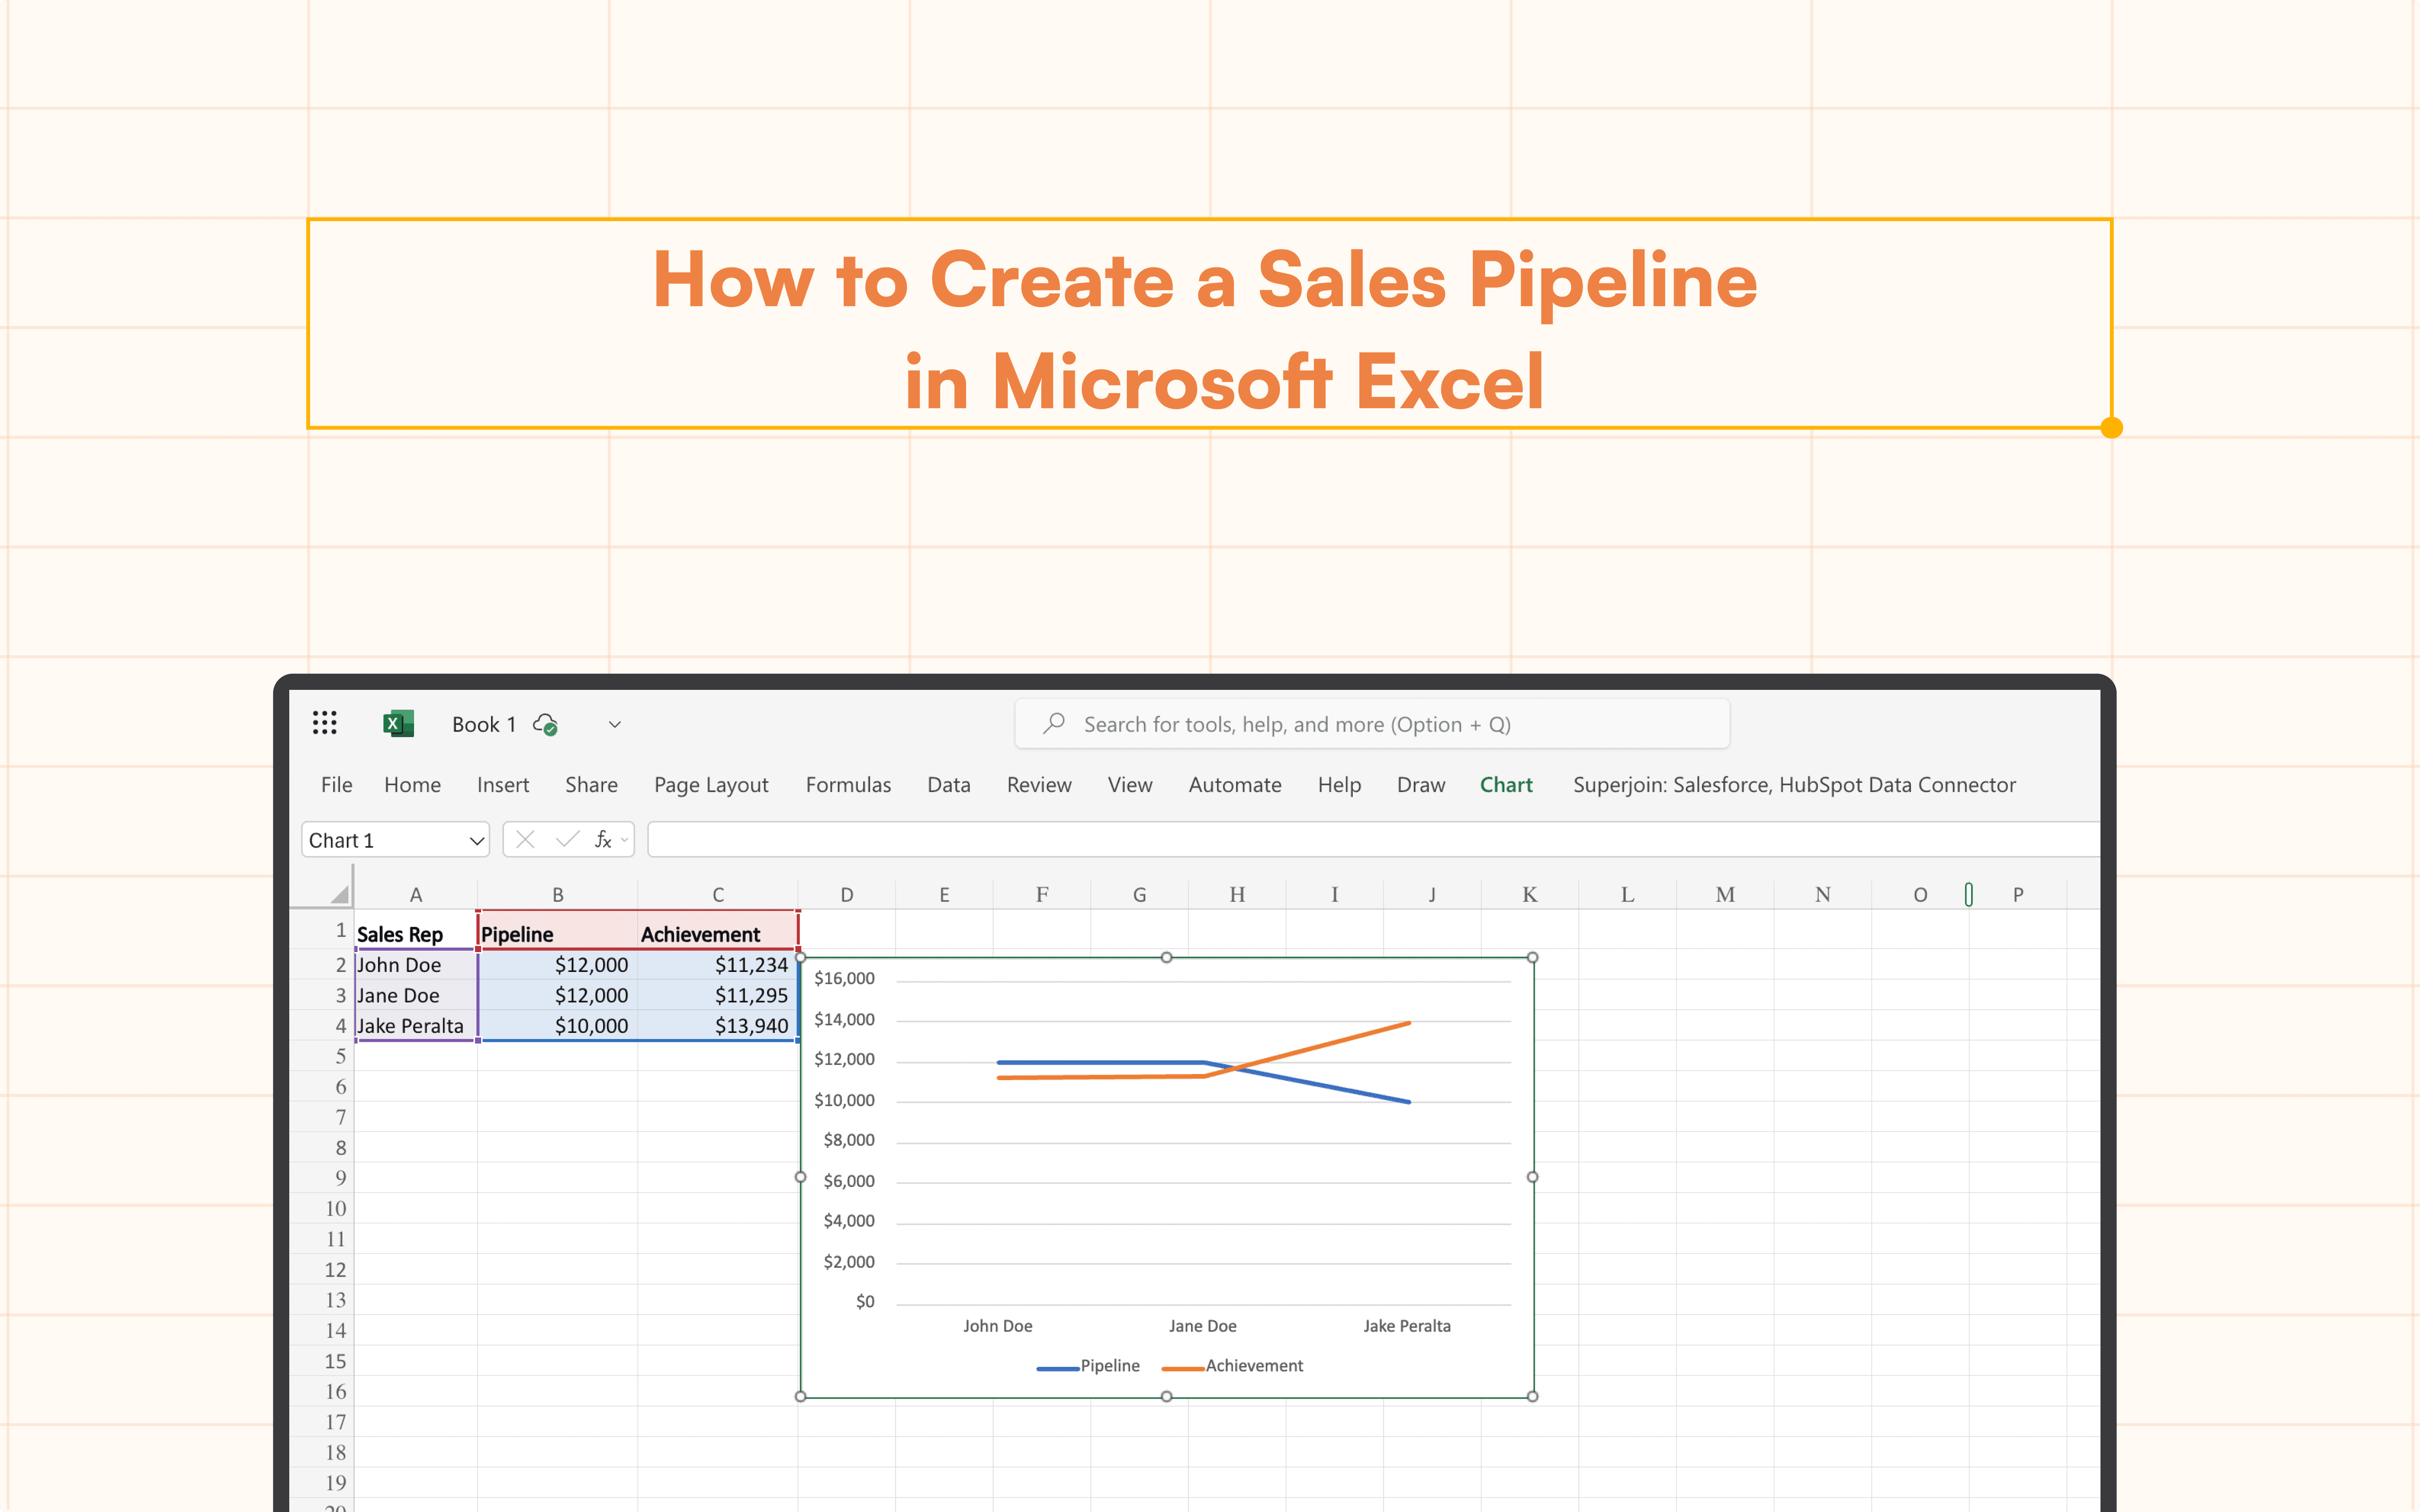
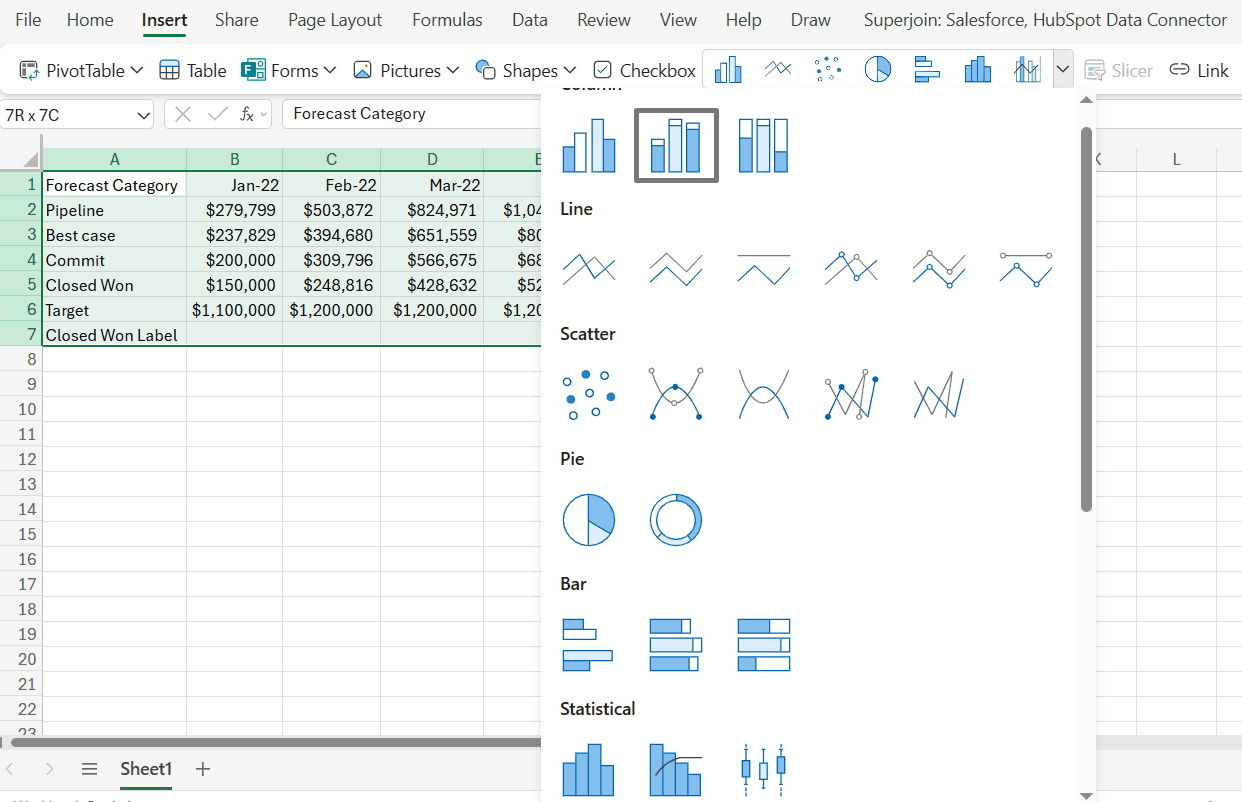
4. Now, create your sales pipeline tracker chart. Select the entire range, then navigate to the top menu and click on 'Insert' followed by 'Chart'.
5. Format and Customize: Excel will automatically create a combo chart. You can now customize the chart by double-clicking on different chart elements (e.g., bars, lines, axes) to access formatting options. These options allow you to change colors, and fonts, add labels, and adjust the overall layout of the chart to best represent your data.
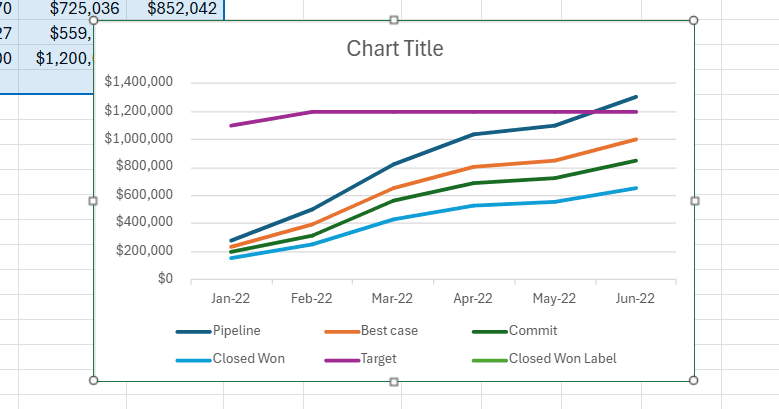
With Superjoin and Excel, you can now easily see how your sales deals progress over the year, all thanks to your Hubspot data being readily available in just a few minutes.
If you're using Google Sheets, skip building your tracker. Use our free, ready-made Sales Pipeline Template in Google Sheets! This lets you start monitoring your sales process immediately.
Conclusion
For any organization, monitoring your sales pipeline is crucial. You may uncover bottlenecks, obtain important insights into your sales process, and eventually close more deals by putting in place a sales pipeline tracker. Excel offers a strong and intuitive framework for managing your sales funnel, regardless of whether you decide to use our sales pipeline template or create your own from fresh following the procedures mentioned above.
Thus, take charge of your sales process right now and begin using Excel to track your pipeline!
Having trouble keeping your Excel data current? RevOps professionals utilize Superjoin, a well-known spreadsheet automation application, to help! By seamlessly syncing data into your Sheets from several sources, including CRM, databases, and ad networks, it saves you time.
Bid farewell to tedious exports and repetitive tasks. With Superjoin, you can add 1 additional day to your week. Try Superjoin for free or schedule a demo.
A clear funnel is essential to the success of any sales team. It gives you a clear picture of prospective sales, how they are progressing through the sales cycle, and, in the end, how well your income stream is doing. However, running a complicated pipeline can be difficult, particularly for startups or smaller companies.
Excel is useful in this situation. Excel provides an excellent basis for creating a personalized sales pipeline tracker, and it is a freely downloadable tool. In this blog, we'll walk you through the steps of building your own tracker and show you how to use Superjoin, a robust Excel add-in, to further improve the functionality of your pipeline.
Why Use Microsoft Excel for Your Sales Pipeline?
Here's why Excel is a great option for building your sales pipeline tracker:
Free and Accessible: Excel is accessible and free, making it an affordable option for companies of all sizes.
Collaborative: Transparency and real-time communication are promoted by the tracker's simultaneous access and updating by several team members.
Customizable: You can modify the tracker to meet your unique data requirements and sales process.
Things to Consider before Building Your Sales Pipeline Tracker
Let's get started! Here's a breakdown of the steps involved:
Step 1. Define Your Sales Stages
The first step is to identify the distinct stages your prospects go through in your sales cycle. Common examples include:
Lead Generation - Identifying potential customers.
Qualification - Assessing a lead's fit for your product or service.
Proposal/Quote - Presenting your offer to the qualified lead.
Negotiation - Discussing terms and pricing.
Closed Won/Lost - The final outcome of the sales process.
Step 2. Design Your Spreadsheet
Open a new Excel Sheet and create a clear layout for your tracker. Let's cover some important aspects to consider:
Columns:
Prospect Name: Company or individual name.
Contact Information: Name, email, phone number.
Sales Stage: Dropdown menu or a designated column for each stage.
Deal Value: Estimated value of the sale.
Close Date: Target date for closing the deal.
Sales Rep: Assigned salesperson (optional).
Additional Columns: You can include custom columns depending on your needs, such as "Notes," "Next Steps," or "Competitors."
Rows:
Each row represents a potential deal.
Step 3. Populate Your Tracker
Start by adding leads and their details to the relevant columns. Utilize conditional formatting to visually differentiate based on the sales stage (e.g., color-code each stage).
Step 4. Formulas and Functions
Leverage Excel's built-in formulas to automate calculations and gain valuable insights. Here are some examples:
SUMIFS: Calculate the total potential revenue in each sales stage.
COUNTIFS: Track the number of deals at different stages.
VLOOKUP: Automatically populate data from other sheets within your workbook.
Step 5. Charts and Dashboards
Visualize your sales pipeline with charts and graphs. Excel offers a variety of options, including bar charts, pie charts, and line graphs. Create insightful dashboards to monitor key metrics and identify trends, like conversion rates or average deal size by stage.
Supercharge Your Sales Pipeline Template Excel with Superjoin
While Excel provides a solid foundation, Superjoin takes your sales pipeline tracker to the next level. Superjoin is a powerful Excel connector that unlocks a plethora of features to streamline your sales process and boost efficiency.
Automated Workflows: Simplify repetitive tasks with automated workflows. Set up triggers that automatically update stages, send email notifications, or assign tasks based on specific criteria.
A Step-by-Step Guide to Create a Sales Pipeline in Excel using Hubspot Data
HubSpot empowers businesses to cultivate strong customer relationships through centralized contact and deal management. But sometimes, you might need to analyze your data in a different format, like the familiar and versatile world of Excel.
HubSpot's default reporting system lacks built-in scheduling for exports. This means manually exporting reports at regular intervals and relying on email reminders for new data. This approach can be inefficient and lead to outdated information.
Superjoin offers a solution to automate HubSpot report exports to Excel. Here's how it works:
A. Install Superjoin
Install Superjoin on Microsoft Excel
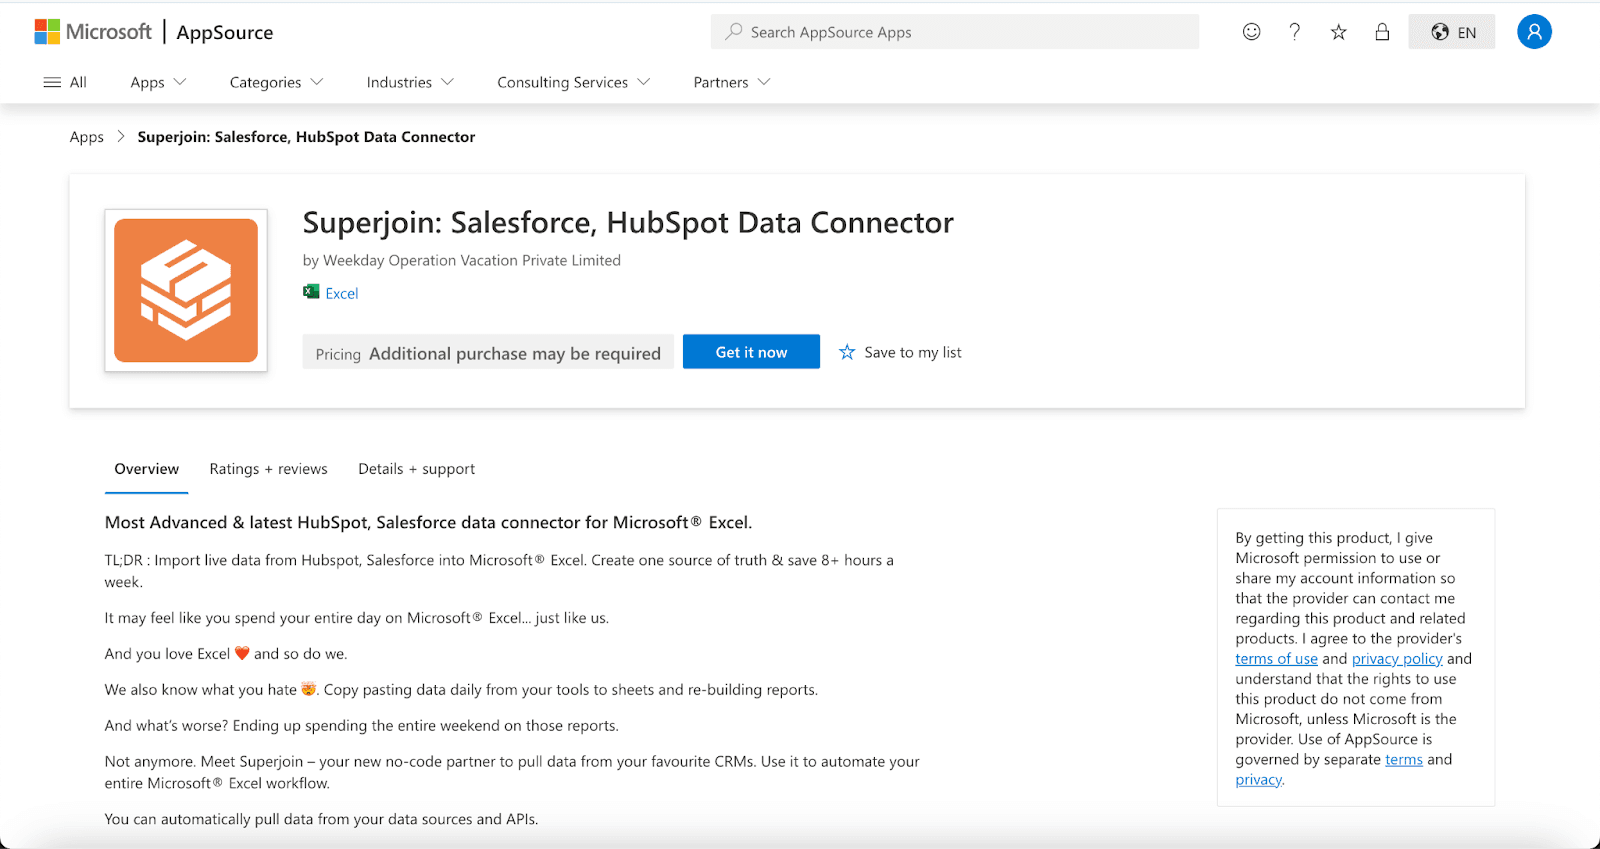
Step 1: Open this link, click on Get it now.
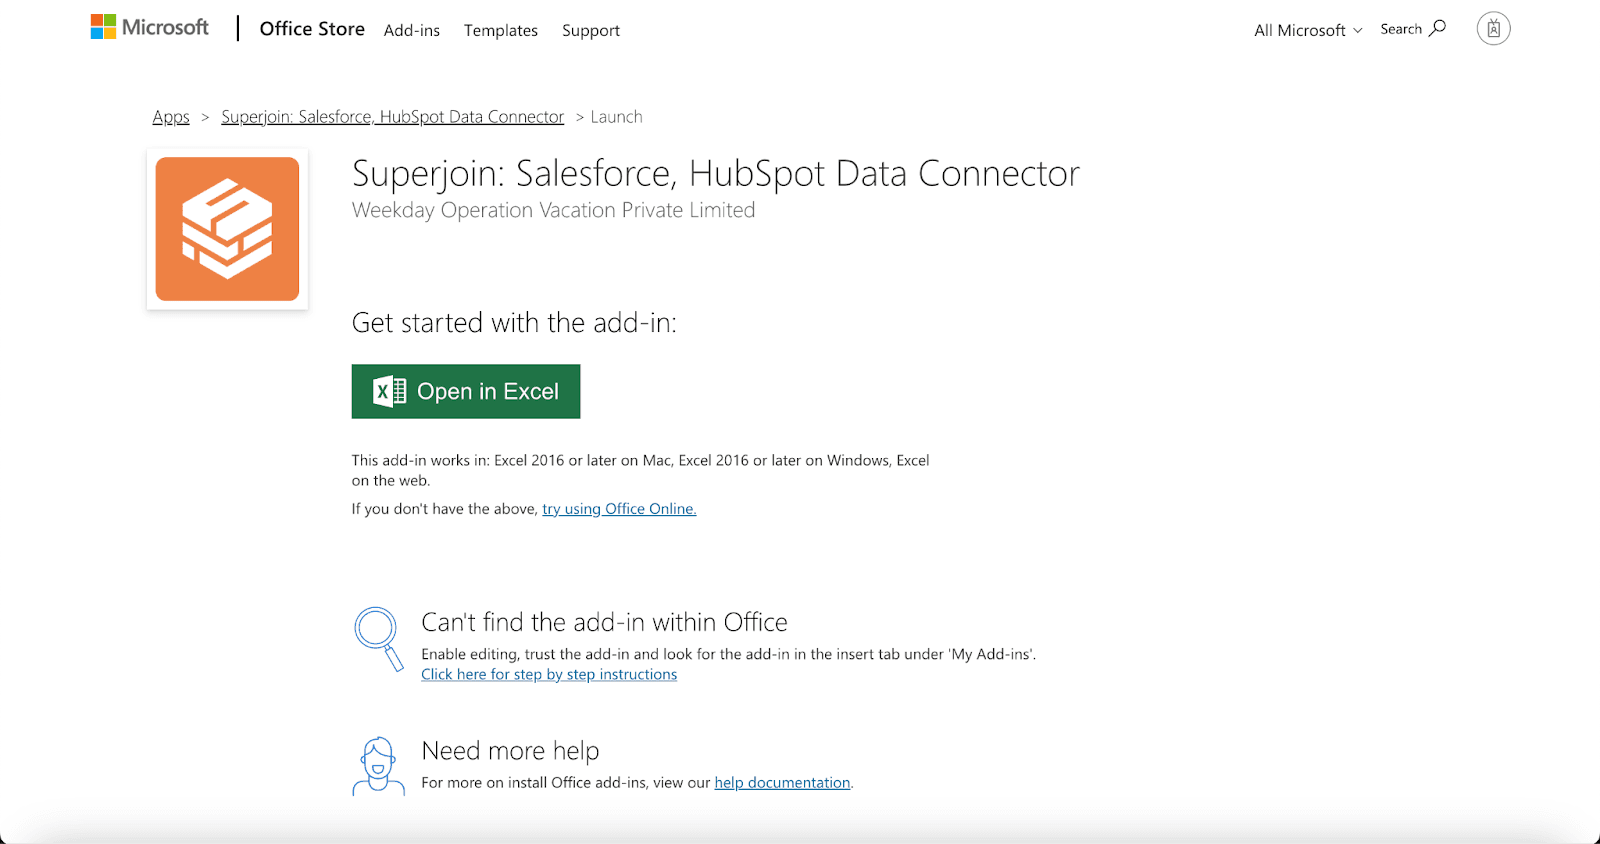
Once installed, click on Open in Excel or Try using it online (for Excel online).
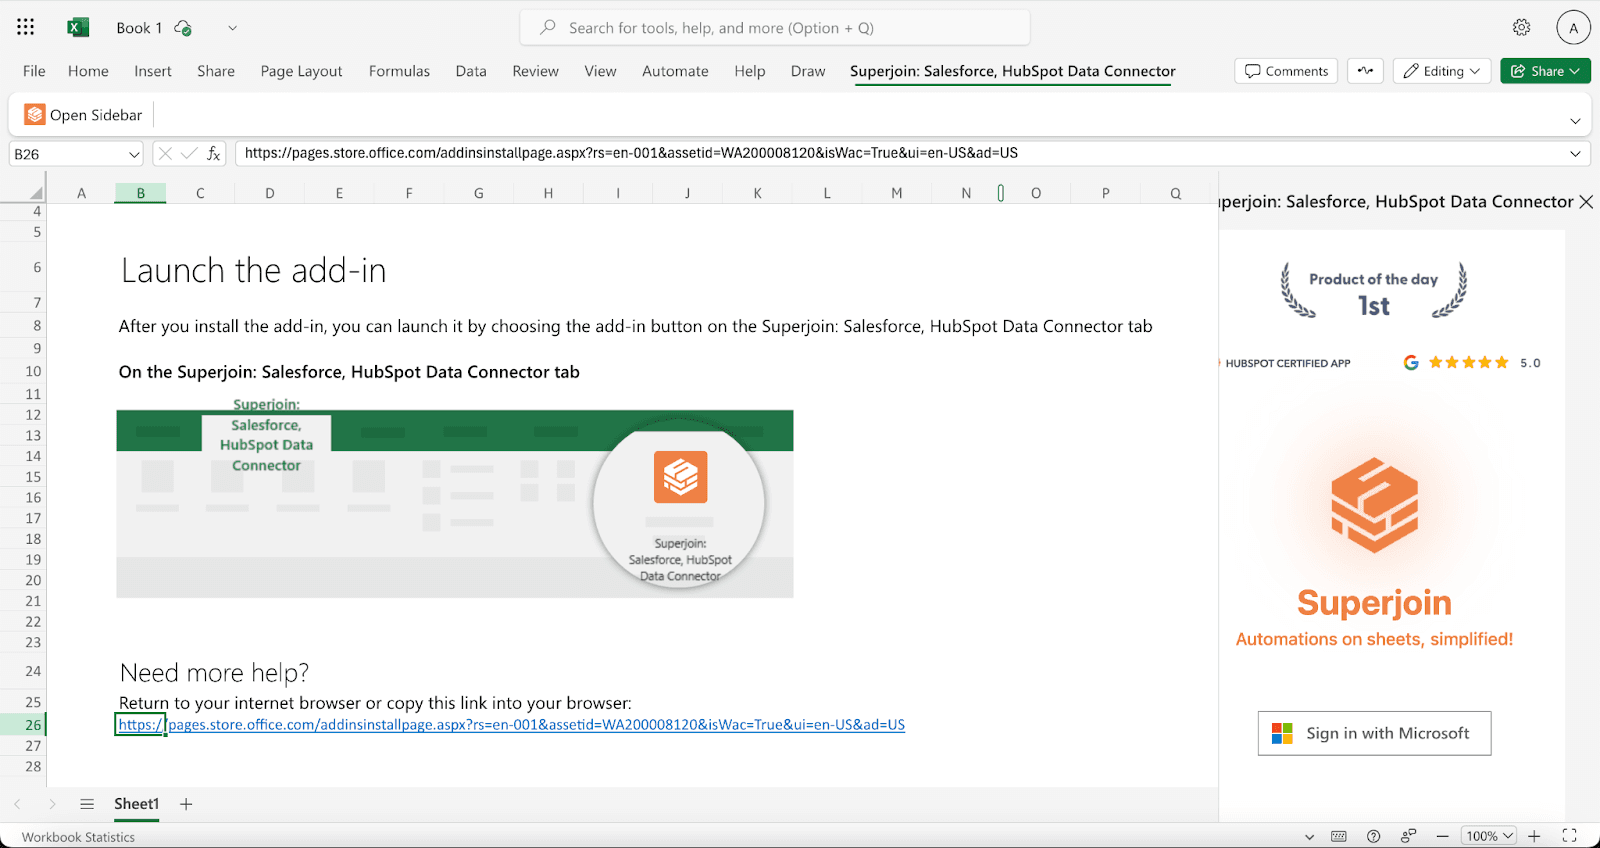
Step 2: Launch Superjoin by opening the add-in and clicking on Open Sidebar. Login with your Microsoft account to start using Superjoin.
B. Connect Hubspot
Step 1: Select HubSpot as the Data Source
Click on Sources. Choose HubSpot as the data source.
Click on Connect to connect to your HubSpot account and follow the on-screen instructions.
Step 2: Import Data from HubSpot to Microsoft Excel
Select the data objects you want to import from HubSpot, such as Deals, Contacts, or other relevant information, and click on Import.
Step 3: Set Up Automatic Sync
Set up automatic sync between HubSpot and Microsoft Excel. Set it to auto-refresh on a schedule
Sales Pipeline Stages
Let's define the typical stages in a sales pipeline:
Lead: Initial contact with a potential customer.
Qualified Lead: Lead has been qualified based on certain criteria.
Proposal Sent: A proposal or quote has been sent to the potential customer.
Negotiation: Ongoing discussions and negotiations with the potential customer.
Closed Won: Sale has been successfully completed.
Closed Lost: Lead did not result in a sale.
How To Build Your Sales Pipeline Tracker
In your Excel spreadsheet, create a new sheet to track your sales pipeline. Use data from your HubSpot import, with "Forecast Category" in the first column and months listed across the top row.
Applying the First Formula:
=iferror(INDEX('Opportunity'!$A$3:$M$7,match($B3,'Opportunity'!$A$3:$A$7,0),match(C$2,'Opportunity'!$A$3:$M$3,0)),)Formula Explanation:
This formula uses INDEX and MATCH functions to look up the value from the Opportunity sheet.
INDEX(‘Opportunity’!$A$3:$M$7, finds the correct value within the specified range.
MATCH($B3,’Opportunity’!$A$3:$A$7,0) matches the forecast category.
MATCH(C$2,’Opportunity’!$A$3:$M$3,0) matches the month.
IFERROR is used to handle any errors that might arise from mismatches.
Select cell B3.
Drag the formula across the row to fill in the values for each month.
Then, drag down to fill in for each forecast category.
2. Applying the Second Formula for Closed Won:
=IF(MAX(‘Opportunity’!$B$3:$M$3)=C$7, TEXT(C$11, "$#,##0.0,K"), "")Formula Explanation:
This formula checks if the maximum value in the month row from the Opportunity sheet matches the current month in the target sheet.
If it matches, it formats the value in C$11 as currency.
3. Enter the above formula in the appropriate cell where you want to calculate the "Closed Won" label:
Highlight the cell that holds the formula you entered.
Drag the formula across the row to apply it to each month.
Creating Charts
4. Now, create your sales pipeline tracker chart. Select the entire range, then navigate to the top menu and click on 'Insert' followed by 'Chart'.
5. Format and Customize: Excel will automatically create a combo chart. You can now customize the chart by double-clicking on different chart elements (e.g., bars, lines, axes) to access formatting options. These options allow you to change colors, and fonts, add labels, and adjust the overall layout of the chart to best represent your data.
With Superjoin and Excel, you can now easily see how your sales deals progress over the year, all thanks to your Hubspot data being readily available in just a few minutes.
If you're using Google Sheets, skip building your tracker. Use our free, ready-made Sales Pipeline Template in Google Sheets! This lets you start monitoring your sales process immediately.
Conclusion
For any organization, monitoring your sales pipeline is crucial. You may uncover bottlenecks, obtain important insights into your sales process, and eventually close more deals by putting in place a sales pipeline tracker. Excel offers a strong and intuitive framework for managing your sales funnel, regardless of whether you decide to use our sales pipeline template or create your own from fresh following the procedures mentioned above.
Thus, take charge of your sales process right now and begin using Excel to track your pipeline!
Having trouble keeping your Excel data current? RevOps professionals utilize Superjoin, a well-known spreadsheet automation application, to help! By seamlessly syncing data into your Sheets from several sources, including CRM, databases, and ad networks, it saves you time.
Bid farewell to tedious exports and repetitive tasks. With Superjoin, you can add 1 additional day to your week. Try Superjoin for free or schedule a demo.
FAQs
What data should I track in my sales pipeline?
What data should I track in my sales pipeline?
Automatic Data Pulls
Visual Data Preview
Set Alerts

Try it now