RevOps
Sales Operations Reporting: What Is It? How to Implement It?
Discover the essentials of Sales Operations Reporting, its importance in driving business success, and a step-by-step guide on how to implement it effectively.
Table of Contents
Sales operations reporting is an essential component of any successful sales strategy. It involves the collection, analysis, and reporting of sales data to provide insights that can drive decision-making and improve sales performance. In this comprehensive guide, we will delve into what sales operations reporting is, why it is important, and how to implement it effectively in your organization.
Understanding Sales Operations Reporting
What is Sales Operations Reporting?
Sales operations reporting refers to the process of gathering, analyzing, and presenting sales data to help businesses make informed decisions. This involves various activities such as tracking sales performance, monitoring key metrics, identifying trends, and providing actionable insights to improve overall sales effectiveness. The goal of sales operations reporting is to support sales teams by providing them with the information they need to optimize their efforts and achieve their targets.
Why Sales Operations are Important?
Sales operations reporting is crucial for several reasons:
Data-Driven Decision Making: Sales operations reporting enables sales leaders to make informed decisions based on accurate and timely data. Instead of relying on intuition or guesswork, decisions are grounded in solid evidence, leading to better outcomes and more strategic planning.
Performance Monitoring: Regular reporting helps in tracking the performance of sales teams and individuals against set targets and goals. It allows managers to identify top performers, recognize areas for improvement, and provide necessary support and training where needed.
Resource Optimization: By analyzing sales data, businesses can allocate resources more effectively to areas that yield the highest returns. This means focusing efforts on high-potential opportunities and optimizing the use of sales tools and technologies to maximize efficiency and effectiveness.
Strategy Development: Insights from sales reports can inform strategic planning and help in adjusting sales strategies to meet changing market conditions. This ensures that sales efforts are aligned with overall business objectives and responsive to external factors such as market trends and competitive pressures.
Key Components of Sales Operations Reporting
Data Collection
The first step in sales operations reporting is data collection. This involves gathering relevant sales data from various sources, including:
CRM Systems: Customer relationship management (CRM) systems are a primary source of sales data, capturing information on customer interactions, sales opportunities, and deal progress. These systems store critical details about customer behavior, preferences, and history, providing a comprehensive view of sales activities.
Sales Enablement Tools: Tools that provide additional data on sales activities, such as email tracking, call analytics, and content usage. These tools help in understanding how sales representatives engage with prospects and customers, allowing for the optimization of sales processes and techniques.
ERP Systems: Enterprise resource planning (ERP) systems that track order processing, inventory levels, and financial transactions. These systems provide insights into the operational aspects of sales, such as product availability, delivery times, and financial performance, which are crucial for strategic planning.
External Sources: Market data, competitor analysis, and industry benchmarks. These external sources provide context to internal sales data, helping businesses understand their position in the market and identify potential areas for growth and improvement.
Data Analysis
After gathering the data, the subsequent step is to conduct an analysis. This involves:
Data Cleaning: Ensuring the data is accurate, complete, and free from duplicates. This step is critical for maintaining data integrity and reliability, as inaccurate or incomplete data can lead to incorrect conclusions and poor decision-making.
Data Integration: Combining data from different sources to get a holistic view of sales performance. This involves creating a unified dataset that allows for comprehensive analysis and a deeper understanding of sales dynamics.
Statistical Analysis: Using statistical methods to identify trends, correlations, and anomalies. This step helps in uncovering patterns and insights that might not be immediately apparent, providing a basis for data-driven decision-making.
Predictive Analytics: Leveraging machine learning and AI to forecast future sales and identify potential opportunities and risks. Predictive analytics can provide forward-looking insights that help businesses anticipate changes in the market and adapt their strategies accordingly.
Reporting and Visualization
The final step in the process is to present the analyzed data in a way that is easy to understand and actionable. This involves:
Dashboards: Interactive dashboards that provide real-time insights and allow users to drill down into specific metrics. Dashboards offer a dynamic and visual way to monitor sales performance, making it easy to track key metrics and identify trends at a glance.
Reports: Regularly scheduled reports that summarize key findings and provide recommendations. These reports are typically distributed to stakeholders at various levels, providing them with the information they need to make informed decisions and take appropriate actions.
Visualizations: Charts, graphs, and other visual aids that help in understanding complex data sets. Visualizations make it easier to comprehend large amounts of data, highlighting important trends and patterns in a clear and concise manner.
Benefits of Sales Operations Reporting
Improved Decision Making
Sales operations reporting provides sales leaders with the data they need to make informed decisions. By having access to accurate and timely information, they can identify issues, capitalize on opportunities, and adjust strategies accordingly. This leads to more effective decision-making and better overall business outcomes.
Enhanced Sales Performance
By monitoring key performance indicators (KPIs) and tracking progress against goals, sales operations reporting helps improve the performance of sales teams. It provides insights into what is working and what is not, allowing for timely interventions and support. This can lead to higher sales productivity, increased revenue, and a more motivated and engaged sales team.
Better Resource Allocation
With detailed insights into sales performance, businesses can allocate resources more effectively. This means focusing efforts on high-potential opportunities and optimizing the use of sales tools and technologies. By understanding where resources are most needed and where they will have the greatest impact, businesses can achieve better results and maximize their return on investment.
Steps to Implement Sales Operations Reporting
1. Define Objectives and KPIs
The first step in implementing sales operations reporting is to define clear objectives and key performance indicators (KPIs). This involves:
Setting Goals: Determining what you want to achieve with your sales operations reporting. This could be increasing sales revenue, improving win rates, reducing sales cycle times, or enhancing customer satisfaction. Clear goals provide direction and focus for your reporting efforts.
Identifying KPIs: Select the metrics that will help you track progress towards your goals. Common KPIs include sales growth, average deal size, conversion rates, customer acquisition costs, and pipeline velocity. These metrics should be relevant to your objectives and provide actionable insights.
2. Choose the Right Tools
Next, you need to choose the right tools for data collection, analysis, and reporting. This involves:
CRM Systems: Selecting a CRM system that meets your needs and integrates with other tools, such as Superjoin, is crucial. A robust CRM system is the backbone of your sales operations reporting, providing a centralized repository for all your sales data.
Analytics Tools: Use tools like Tableau, Power BI, or Looker for data analysis and visualization. These tools offer advanced analytical capabilities and powerful visualizations that can help you make sense of complex data sets.
Sales Enablement Platforms: Leveraging platforms that provide additional insights into sales activities and performance. These platforms can enhance your CRM system by providing detailed analytics on sales interactions, content usage, and engagement metrics.
3. Collect and Organize Data
Once you have the right tools in place, you need to collect and organize your data. This involves:
Data Integration: Integrating data from different sources to create a unified data set. This step is crucial for obtaining a comprehensive view of sales performance and ensuring that all relevant data is included in your analysis.
Data Cleaning: Ensuring the data is accurate, complete, and free from duplicates. Regular data cleaning is essential for maintaining the quality and reliability of your data, which is the foundation of your reporting efforts.
Data Structuring: Organizing the data in a way that makes it easy to analyze and report on. This involves creating a logical structure for your data, with clear relationships between different data points, to facilitate effective analysis and reporting.
4. Analyze Data
Once you've gathered and structured your data, the subsequent phase involves scrutinizing it for analysis. This involves:
Descriptive Analysis: Summarizing the data to understand past performance. This type of analysis provides a historical perspective, helping you identify trends, patterns, and areas for improvement.
Diagnostic Analysis: Identifying the reasons behind certain performance trends. Diagnostic analysis helps you understand the root causes of performance issues, enabling you to take corrective actions and improve future outcomes.
Predictive Analysis: Forecasting future sales based on historical data. Predictive analysis uses statistical models and machine learning algorithms to predict future sales trends, helping you anticipate changes in the market and plan accordingly.
Prescriptive Analysis: Providing recommendations on how to improve sales performance. Prescriptive analysis goes beyond predicting future trends, and offering specific recommendations for actions that can enhance sales performance and achieve business goals.
5. Generate Reports
Once the data is analyzed, you need to generate reports that provide actionable insights. This involves:
Dashboards: Creating interactive dashboards with Superjoin that provide real-time insights and allow users to drill down into specific metrics. Superjoin’s dashboards offer a dynamic and visual way to monitor sales performance, making it easy to track key metrics and identify trends at a glance. They are highly customizable to meet the specific needs of different users, such as sales managers, executives, and individual sales reps.
Scheduled Reports: Setting up regular reports that summarize key findings and provide recommendations. These reports can be generated on a daily, weekly, or monthly basis, depending on the needs of the organization. Regular reporting ensures that stakeholders are consistently informed about sales performance and can make timely decisions.
Custom Reports: Creating custom reports for specific stakeholders or purposes. Custom reports can address unique questions or concerns, providing detailed insights into specific areas of interest. For example, a custom report might focus on the performance of a particular sales region, product line, or customer segment.
6. Review and Adjust
The final step in the process is to review the reports and make any necessary adjustments. This involves:
Regular Reviews: Holding regular review meetings to discuss the findings and take action. These meetings provide an opportunity for sales teams to come together, discuss the insights from the reports, and develop action plans to address any issues or capitalize on opportunities.
Continuous Improvement: Continuously improving the reporting process based on feedback and changing needs. This involves soliciting feedback from users, making adjustments to the reporting tools and processes, and staying current with best practices and industry trends. Continuous improvement ensures that the reporting system remains effective and relevant.
Common Challenges and How to Overcome Them
Data Quality Issues
One of the biggest challenges in sales operations reporting is ensuring data quality. Low-quality data may result in erroneous interpretations and ill-informed choices. This challenge can be addressed by:
Data Validation: Implementing validation rules to ensure data is accurate and complete. Validation rules can check for errors, such as missing or inconsistent data, and prompt users to correct them before the data is saved.
Data Cleaning: Regularly cleaning the data to remove duplicates and correct errors. Data cleaning involves identifying and resolving data quality issues, such as duplicates, inaccuracies, and inconsistencies, to ensure the integrity of the data.
Training: Providing training to sales teams on the importance of data quality and how to ensure it. Training can help sales reps understand the impact of data quality on reporting and decision-making, and equip them with best practices for data entry and management.
Integration with Other Systems
Another challenge is integrating data from different systems. Sales data is often stored in multiple systems, such as CRM, ERP, and sales enablement tools, making it difficult to get a unified view. This challenge can be addressed by:
Using Integration Tools: Leveraging tools that facilitate data integration, such as APIs and middleware. Integration tools can automate the process of combining data from different sources, ensuring that the data is consistent and up-to-date.
Standardizing Data Formats: Standardizing data formats to make it easier to integrate data from different sources. Standardization involves defining consistent data formats and structures, such as common field names and data types, to ensure compatibility between systems.
Working with IT: Collaborating with IT to ensure seamless integration of systems. Working closely with IT can help address technical challenges, such as data mapping and synchronization, and ensure that the integration process is efficient and effective.
Creating a Sales Funnel Analysis Report in Google Sheets Using the Chart Editor Feature
Google Sheets is a versatile tool that can be used to create detailed sales funnel analysis reports. Using the Chart Editor feature, you can visualize your sales data effectively. Here’s a step-by-step guide to creating a sales funnel analysis report in Google Sheets:
Step 1: Prepare Your Data
1. Open Google Sheets: Go to Google Sheets and open a new or existing spreadsheet.
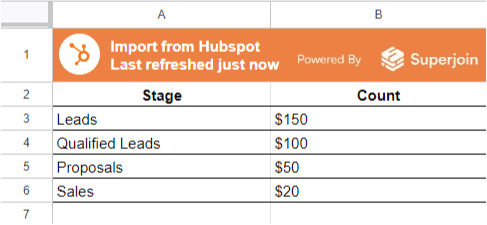
2. Enter Your Sales Data: Organize your sales data in columns. Typically, you’ll have stages of your sales funnel (e.g., Leads, Qualified Leads, Proposals, Sales) in one column and corresponding counts in the adjacent column. Example:
Step 2: Select the Data
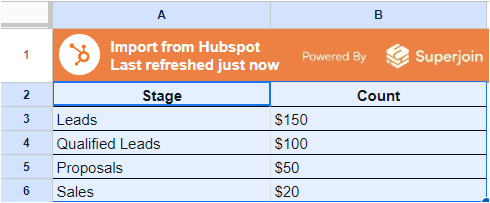
1. Highlight Your Data: Click and drag to highlight the range of cells containing your sales stages and counts.
Step 3: Insert a Chart
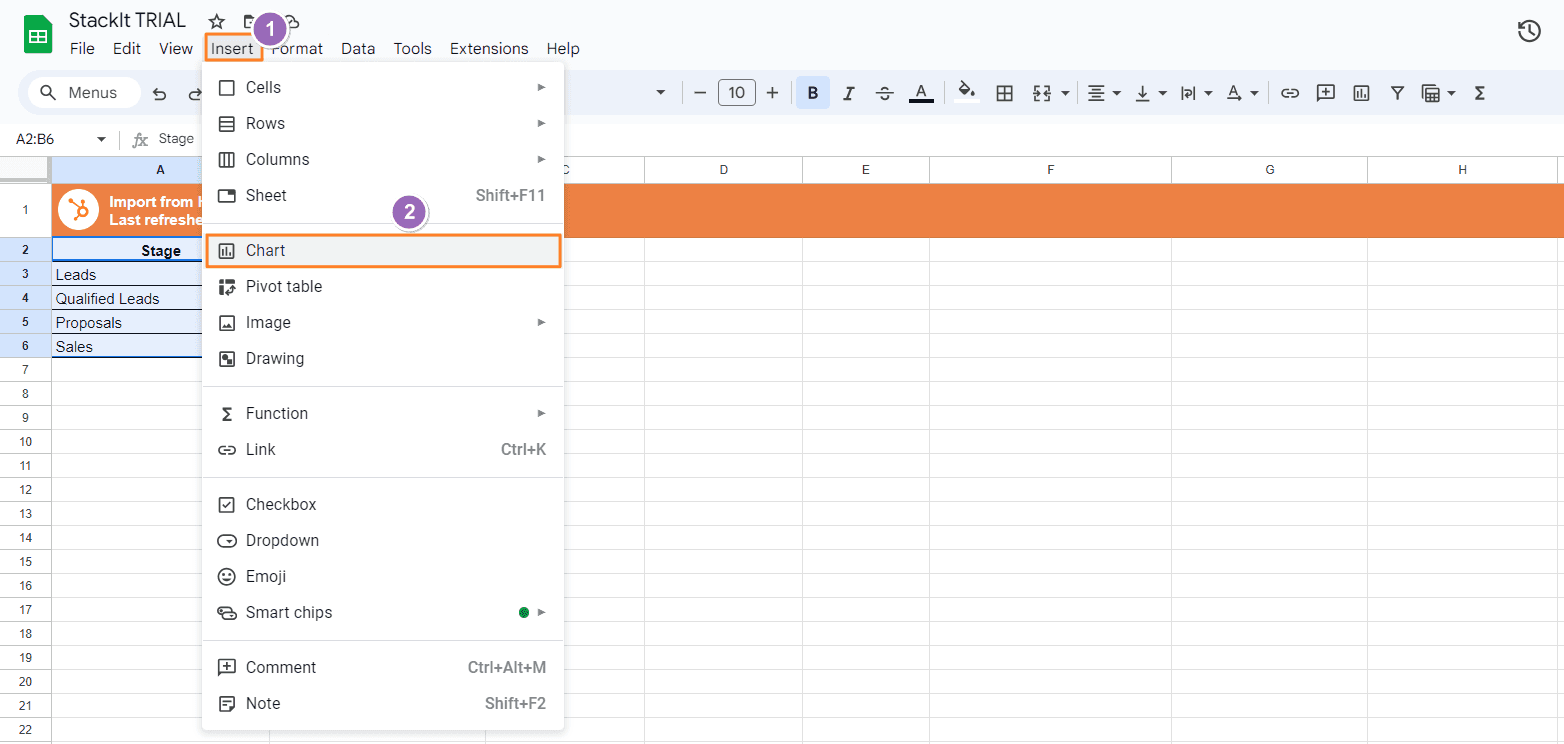
1. Open Chart Editor:
With your data highlighted, go to the top menu and click on Insert > Chart.
This will open the Chart Editor on the right side of the screen.
Step 4: Choose Chart Type
1. Select Chart Type:
In the Chart Editor, click on the Chart type dropdown.
Choose a chart type suitable for funnel analysis. A common choice is the Column chart, which can be customized to look like a funnel.
Step 5: Customize the Chart
1. Customize the Chart:
In the Chart Editor, go to the Customize tab.
Adjust the settings as needed:
Chart & axis titles: Add titles to your chart and axes for clarity.
Series: Adjust the colors and appearance of the data series to enhance visualization.
Vertical axis: Optionally, reverse the order to make the chart resemble a funnel.
Stacked Columns:
To create a more traditional funnel chart, you can stack the columns. Under Series, select the option to stack columns if available.
Step 6: Finalize and Insert the Chart
1. Review Your Chart:
Ensure your chart accurately represents your sales funnel data. Make any final adjustments in the Chart Editor.
2. Insert the Chart:
Once satisfied with the chart, close the Chart Editor.
Your chart will now be embedded in your Google Sheet.
Step 7: Analyze and Share
1. Analyze the Data:
Use the chart to analyze your sales funnel, identifying areas for improvement or trends in the data.
2. Share the Report:
Share the Google Sheet with colleagues or stakeholders by clicking on the Share button in the top-right corner.
Adjust sharing settings as needed, allowing others to view or edit the report.
By following these steps, you can create an insightful sales funnel analysis report using Google Sheets and the Chart Editor feature. This visual representation will help you better understand your sales process and make data-driven decisions to optimize your sales funnel.
Best Practices for Effective Sales Operations Reporting
Keep It Simple
One of the best practices for effective sales operations reporting is to keep it simple. This involves:
Focusing on Key Metrics: Focusing on the most important metrics and avoiding information overload. Key metrics should be aligned with business goals and provide actionable insights that can drive decision-making.
Clear Visualization: Using clear and simple visualizations to present data. Visualizations should be easy to understand and interpret, helping users quickly grasp the key insights and trends.
Straightforward Reports: Creating reports that are easy to understand and actionable. Reports should be concise and to the point, with a clear structure and logical flow that guides the reader through the findings and recommendations.
Focus on Actionable Insights
Another best practice is to focus on actionable insights. This involves:
Providing Recommendations: Including recommendations on how to improve performance based on the data. Recommendations should be specific, practical, and aligned with business objectives, helping users take meaningful actions to achieve their goals.
Highlighting Key Findings: Highlighting the most important findings in the reports. Key findings should be prominently displayed and clearly communicated, ensuring that users can quickly identify the critical insights that require their attention.
Aligning with Goals: Ensuring the insights are aligned with business goals and objectives. Insights should be relevant to the strategic priorities of the organization and support the achievement of key performance targets.
Continuously Improve
Finally, it is important to continuously improve the sales operations reporting process. This involves:
Regular Feedback: Collecting feedback from users on the reports and dashboards. Feedback can help identify areas for improvement, such as usability issues or gaps in the data, and ensure that the reporting system meets the needs of its users.
Updating Tools: Regularly updating the tools and technologies used for reporting. Keeping the tools up-to-date with the latest features and capabilities can enhance their functionality and effectiveness.
Staying Updated: Keeping up with industry trends and best practices in sales operations reporting. Staying informed about new developments and emerging best practices can help you continuously enhance your reporting process and stay ahead of the competition.
Conclusion
Sales operations reporting is a critical component of any successful sales strategy. It provides the data and insights needed to make informed decisions, improve sales performance, and optimize resources. By following the steps outlined in this guide and adhering to best practices, businesses can implement effective sales operations reporting that drives success. While there are challenges to overcome, such as data quality issues and user adoption, these can be addressed with the right tools and processes. Ultimately, the goal is to create a reporting system that provides actionable insights and supports continuous improvement in sales operations.
Say Goodbye to Tedious Data Exports! 🚀
Are you tired of the hassle of manually moving data from various tools into Google Sheets? Superjoin has a solution for you.
Superjoin is a Google Sheets add-on that automatically connects your favorite SaaS tools to your spreadsheets. It pulls data directly into Google Sheets, allowing you to create reports that update themselves without any manual work on your part.
Sales operations reporting is an essential component of any successful sales strategy. It involves the collection, analysis, and reporting of sales data to provide insights that can drive decision-making and improve sales performance. In this comprehensive guide, we will delve into what sales operations reporting is, why it is important, and how to implement it effectively in your organization.
Understanding Sales Operations Reporting
What is Sales Operations Reporting?
Sales operations reporting refers to the process of gathering, analyzing, and presenting sales data to help businesses make informed decisions. This involves various activities such as tracking sales performance, monitoring key metrics, identifying trends, and providing actionable insights to improve overall sales effectiveness. The goal of sales operations reporting is to support sales teams by providing them with the information they need to optimize their efforts and achieve their targets.
Why Sales Operations are Important?
Sales operations reporting is crucial for several reasons:
Data-Driven Decision Making: Sales operations reporting enables sales leaders to make informed decisions based on accurate and timely data. Instead of relying on intuition or guesswork, decisions are grounded in solid evidence, leading to better outcomes and more strategic planning.
Performance Monitoring: Regular reporting helps in tracking the performance of sales teams and individuals against set targets and goals. It allows managers to identify top performers, recognize areas for improvement, and provide necessary support and training where needed.
Resource Optimization: By analyzing sales data, businesses can allocate resources more effectively to areas that yield the highest returns. This means focusing efforts on high-potential opportunities and optimizing the use of sales tools and technologies to maximize efficiency and effectiveness.
Strategy Development: Insights from sales reports can inform strategic planning and help in adjusting sales strategies to meet changing market conditions. This ensures that sales efforts are aligned with overall business objectives and responsive to external factors such as market trends and competitive pressures.
Key Components of Sales Operations Reporting
Data Collection
The first step in sales operations reporting is data collection. This involves gathering relevant sales data from various sources, including:
CRM Systems: Customer relationship management (CRM) systems are a primary source of sales data, capturing information on customer interactions, sales opportunities, and deal progress. These systems store critical details about customer behavior, preferences, and history, providing a comprehensive view of sales activities.
Sales Enablement Tools: Tools that provide additional data on sales activities, such as email tracking, call analytics, and content usage. These tools help in understanding how sales representatives engage with prospects and customers, allowing for the optimization of sales processes and techniques.
ERP Systems: Enterprise resource planning (ERP) systems that track order processing, inventory levels, and financial transactions. These systems provide insights into the operational aspects of sales, such as product availability, delivery times, and financial performance, which are crucial for strategic planning.
External Sources: Market data, competitor analysis, and industry benchmarks. These external sources provide context to internal sales data, helping businesses understand their position in the market and identify potential areas for growth and improvement.
Data Analysis
After gathering the data, the subsequent step is to conduct an analysis. This involves:
Data Cleaning: Ensuring the data is accurate, complete, and free from duplicates. This step is critical for maintaining data integrity and reliability, as inaccurate or incomplete data can lead to incorrect conclusions and poor decision-making.
Data Integration: Combining data from different sources to get a holistic view of sales performance. This involves creating a unified dataset that allows for comprehensive analysis and a deeper understanding of sales dynamics.
Statistical Analysis: Using statistical methods to identify trends, correlations, and anomalies. This step helps in uncovering patterns and insights that might not be immediately apparent, providing a basis for data-driven decision-making.
Predictive Analytics: Leveraging machine learning and AI to forecast future sales and identify potential opportunities and risks. Predictive analytics can provide forward-looking insights that help businesses anticipate changes in the market and adapt their strategies accordingly.
Reporting and Visualization
The final step in the process is to present the analyzed data in a way that is easy to understand and actionable. This involves:
Dashboards: Interactive dashboards that provide real-time insights and allow users to drill down into specific metrics. Dashboards offer a dynamic and visual way to monitor sales performance, making it easy to track key metrics and identify trends at a glance.
Reports: Regularly scheduled reports that summarize key findings and provide recommendations. These reports are typically distributed to stakeholders at various levels, providing them with the information they need to make informed decisions and take appropriate actions.
Visualizations: Charts, graphs, and other visual aids that help in understanding complex data sets. Visualizations make it easier to comprehend large amounts of data, highlighting important trends and patterns in a clear and concise manner.
Benefits of Sales Operations Reporting
Improved Decision Making
Sales operations reporting provides sales leaders with the data they need to make informed decisions. By having access to accurate and timely information, they can identify issues, capitalize on opportunities, and adjust strategies accordingly. This leads to more effective decision-making and better overall business outcomes.
Enhanced Sales Performance
By monitoring key performance indicators (KPIs) and tracking progress against goals, sales operations reporting helps improve the performance of sales teams. It provides insights into what is working and what is not, allowing for timely interventions and support. This can lead to higher sales productivity, increased revenue, and a more motivated and engaged sales team.
Better Resource Allocation
With detailed insights into sales performance, businesses can allocate resources more effectively. This means focusing efforts on high-potential opportunities and optimizing the use of sales tools and technologies. By understanding where resources are most needed and where they will have the greatest impact, businesses can achieve better results and maximize their return on investment.
Steps to Implement Sales Operations Reporting
1. Define Objectives and KPIs
The first step in implementing sales operations reporting is to define clear objectives and key performance indicators (KPIs). This involves:
Setting Goals: Determining what you want to achieve with your sales operations reporting. This could be increasing sales revenue, improving win rates, reducing sales cycle times, or enhancing customer satisfaction. Clear goals provide direction and focus for your reporting efforts.
Identifying KPIs: Select the metrics that will help you track progress towards your goals. Common KPIs include sales growth, average deal size, conversion rates, customer acquisition costs, and pipeline velocity. These metrics should be relevant to your objectives and provide actionable insights.
2. Choose the Right Tools
Next, you need to choose the right tools for data collection, analysis, and reporting. This involves:
CRM Systems: Selecting a CRM system that meets your needs and integrates with other tools, such as Superjoin, is crucial. A robust CRM system is the backbone of your sales operations reporting, providing a centralized repository for all your sales data.
Analytics Tools: Use tools like Tableau, Power BI, or Looker for data analysis and visualization. These tools offer advanced analytical capabilities and powerful visualizations that can help you make sense of complex data sets.
Sales Enablement Platforms: Leveraging platforms that provide additional insights into sales activities and performance. These platforms can enhance your CRM system by providing detailed analytics on sales interactions, content usage, and engagement metrics.
3. Collect and Organize Data
Once you have the right tools in place, you need to collect and organize your data. This involves:
Data Integration: Integrating data from different sources to create a unified data set. This step is crucial for obtaining a comprehensive view of sales performance and ensuring that all relevant data is included in your analysis.
Data Cleaning: Ensuring the data is accurate, complete, and free from duplicates. Regular data cleaning is essential for maintaining the quality and reliability of your data, which is the foundation of your reporting efforts.
Data Structuring: Organizing the data in a way that makes it easy to analyze and report on. This involves creating a logical structure for your data, with clear relationships between different data points, to facilitate effective analysis and reporting.
4. Analyze Data
Once you've gathered and structured your data, the subsequent phase involves scrutinizing it for analysis. This involves:
Descriptive Analysis: Summarizing the data to understand past performance. This type of analysis provides a historical perspective, helping you identify trends, patterns, and areas for improvement.
Diagnostic Analysis: Identifying the reasons behind certain performance trends. Diagnostic analysis helps you understand the root causes of performance issues, enabling you to take corrective actions and improve future outcomes.
Predictive Analysis: Forecasting future sales based on historical data. Predictive analysis uses statistical models and machine learning algorithms to predict future sales trends, helping you anticipate changes in the market and plan accordingly.
Prescriptive Analysis: Providing recommendations on how to improve sales performance. Prescriptive analysis goes beyond predicting future trends, and offering specific recommendations for actions that can enhance sales performance and achieve business goals.
5. Generate Reports
Once the data is analyzed, you need to generate reports that provide actionable insights. This involves:
Dashboards: Creating interactive dashboards with Superjoin that provide real-time insights and allow users to drill down into specific metrics. Superjoin’s dashboards offer a dynamic and visual way to monitor sales performance, making it easy to track key metrics and identify trends at a glance. They are highly customizable to meet the specific needs of different users, such as sales managers, executives, and individual sales reps.
Scheduled Reports: Setting up regular reports that summarize key findings and provide recommendations. These reports can be generated on a daily, weekly, or monthly basis, depending on the needs of the organization. Regular reporting ensures that stakeholders are consistently informed about sales performance and can make timely decisions.
Custom Reports: Creating custom reports for specific stakeholders or purposes. Custom reports can address unique questions or concerns, providing detailed insights into specific areas of interest. For example, a custom report might focus on the performance of a particular sales region, product line, or customer segment.
6. Review and Adjust
The final step in the process is to review the reports and make any necessary adjustments. This involves:
Regular Reviews: Holding regular review meetings to discuss the findings and take action. These meetings provide an opportunity for sales teams to come together, discuss the insights from the reports, and develop action plans to address any issues or capitalize on opportunities.
Continuous Improvement: Continuously improving the reporting process based on feedback and changing needs. This involves soliciting feedback from users, making adjustments to the reporting tools and processes, and staying current with best practices and industry trends. Continuous improvement ensures that the reporting system remains effective and relevant.
Common Challenges and How to Overcome Them
Data Quality Issues
One of the biggest challenges in sales operations reporting is ensuring data quality. Low-quality data may result in erroneous interpretations and ill-informed choices. This challenge can be addressed by:
Data Validation: Implementing validation rules to ensure data is accurate and complete. Validation rules can check for errors, such as missing or inconsistent data, and prompt users to correct them before the data is saved.
Data Cleaning: Regularly cleaning the data to remove duplicates and correct errors. Data cleaning involves identifying and resolving data quality issues, such as duplicates, inaccuracies, and inconsistencies, to ensure the integrity of the data.
Training: Providing training to sales teams on the importance of data quality and how to ensure it. Training can help sales reps understand the impact of data quality on reporting and decision-making, and equip them with best practices for data entry and management.
Integration with Other Systems
Another challenge is integrating data from different systems. Sales data is often stored in multiple systems, such as CRM, ERP, and sales enablement tools, making it difficult to get a unified view. This challenge can be addressed by:
Using Integration Tools: Leveraging tools that facilitate data integration, such as APIs and middleware. Integration tools can automate the process of combining data from different sources, ensuring that the data is consistent and up-to-date.
Standardizing Data Formats: Standardizing data formats to make it easier to integrate data from different sources. Standardization involves defining consistent data formats and structures, such as common field names and data types, to ensure compatibility between systems.
Working with IT: Collaborating with IT to ensure seamless integration of systems. Working closely with IT can help address technical challenges, such as data mapping and synchronization, and ensure that the integration process is efficient and effective.
Creating a Sales Funnel Analysis Report in Google Sheets Using the Chart Editor Feature
Google Sheets is a versatile tool that can be used to create detailed sales funnel analysis reports. Using the Chart Editor feature, you can visualize your sales data effectively. Here’s a step-by-step guide to creating a sales funnel analysis report in Google Sheets:
Step 1: Prepare Your Data
1. Open Google Sheets: Go to Google Sheets and open a new or existing spreadsheet.
2. Enter Your Sales Data: Organize your sales data in columns. Typically, you’ll have stages of your sales funnel (e.g., Leads, Qualified Leads, Proposals, Sales) in one column and corresponding counts in the adjacent column. Example:
Step 2: Select the Data
1. Highlight Your Data: Click and drag to highlight the range of cells containing your sales stages and counts.
Step 3: Insert a Chart
1. Open Chart Editor:
With your data highlighted, go to the top menu and click on Insert > Chart.
This will open the Chart Editor on the right side of the screen.
Step 4: Choose Chart Type
1. Select Chart Type:
In the Chart Editor, click on the Chart type dropdown.
Choose a chart type suitable for funnel analysis. A common choice is the Column chart, which can be customized to look like a funnel.
Step 5: Customize the Chart
1. Customize the Chart:
In the Chart Editor, go to the Customize tab.
Adjust the settings as needed:
Chart & axis titles: Add titles to your chart and axes for clarity.
Series: Adjust the colors and appearance of the data series to enhance visualization.
Vertical axis: Optionally, reverse the order to make the chart resemble a funnel.
Stacked Columns:
To create a more traditional funnel chart, you can stack the columns. Under Series, select the option to stack columns if available.
Step 6: Finalize and Insert the Chart
1. Review Your Chart:
Ensure your chart accurately represents your sales funnel data. Make any final adjustments in the Chart Editor.
2. Insert the Chart:
Once satisfied with the chart, close the Chart Editor.
Your chart will now be embedded in your Google Sheet.
Step 7: Analyze and Share
1. Analyze the Data:
Use the chart to analyze your sales funnel, identifying areas for improvement or trends in the data.
2. Share the Report:
Share the Google Sheet with colleagues or stakeholders by clicking on the Share button in the top-right corner.
Adjust sharing settings as needed, allowing others to view or edit the report.
By following these steps, you can create an insightful sales funnel analysis report using Google Sheets and the Chart Editor feature. This visual representation will help you better understand your sales process and make data-driven decisions to optimize your sales funnel.
Best Practices for Effective Sales Operations Reporting
Keep It Simple
One of the best practices for effective sales operations reporting is to keep it simple. This involves:
Focusing on Key Metrics: Focusing on the most important metrics and avoiding information overload. Key metrics should be aligned with business goals and provide actionable insights that can drive decision-making.
Clear Visualization: Using clear and simple visualizations to present data. Visualizations should be easy to understand and interpret, helping users quickly grasp the key insights and trends.
Straightforward Reports: Creating reports that are easy to understand and actionable. Reports should be concise and to the point, with a clear structure and logical flow that guides the reader through the findings and recommendations.
Focus on Actionable Insights
Another best practice is to focus on actionable insights. This involves:
Providing Recommendations: Including recommendations on how to improve performance based on the data. Recommendations should be specific, practical, and aligned with business objectives, helping users take meaningful actions to achieve their goals.
Highlighting Key Findings: Highlighting the most important findings in the reports. Key findings should be prominently displayed and clearly communicated, ensuring that users can quickly identify the critical insights that require their attention.
Aligning with Goals: Ensuring the insights are aligned with business goals and objectives. Insights should be relevant to the strategic priorities of the organization and support the achievement of key performance targets.
Continuously Improve
Finally, it is important to continuously improve the sales operations reporting process. This involves:
Regular Feedback: Collecting feedback from users on the reports and dashboards. Feedback can help identify areas for improvement, such as usability issues or gaps in the data, and ensure that the reporting system meets the needs of its users.
Updating Tools: Regularly updating the tools and technologies used for reporting. Keeping the tools up-to-date with the latest features and capabilities can enhance their functionality and effectiveness.
Staying Updated: Keeping up with industry trends and best practices in sales operations reporting. Staying informed about new developments and emerging best practices can help you continuously enhance your reporting process and stay ahead of the competition.
Conclusion
Sales operations reporting is a critical component of any successful sales strategy. It provides the data and insights needed to make informed decisions, improve sales performance, and optimize resources. By following the steps outlined in this guide and adhering to best practices, businesses can implement effective sales operations reporting that drives success. While there are challenges to overcome, such as data quality issues and user adoption, these can be addressed with the right tools and processes. Ultimately, the goal is to create a reporting system that provides actionable insights and supports continuous improvement in sales operations.
Say Goodbye to Tedious Data Exports! 🚀
Are you tired of the hassle of manually moving data from various tools into Google Sheets? Superjoin has a solution for you.
Superjoin is a Google Sheets add-on that automatically connects your favorite SaaS tools to your spreadsheets. It pulls data directly into Google Sheets, allowing you to create reports that update themselves without any manual work on your part.
FAQs
What are some common tools used for sales operations reporting besides CRM systems and analytics platforms?
What are some common tools used for sales operations reporting besides CRM systems and analytics platforms?
How can artificial intelligence (AI) enhance sales operations reporting?
How can artificial intelligence (AI) enhance sales operations reporting?
What role does data governance play in sales operations reporting?
What role does data governance play in sales operations reporting?
Automatic Data Pulls
Visual Data Preview
Set Alerts
Try it now