RevOps
Top Salesforce Reporting Tools for 2025
This blog will guide you on the top Salesforce reporting tools for 2025!
Table of Contents
Salesforce reporting tools have revolutionized how sales managers extract and analyze customer data, sales rep performance, summary reports, and more with the leading Customer Relationship Management (CRM) tool.
There are several powerful, cloud-based reporting tools available on Salesforce AppExchange today, each offering unique features and capabilities. Let’s explore the pros and cons of each tool to understand which one stands out as the best choice for consumers.
1. Native Salesforce Reporting

The Native Salesforce CRM report builder is an excellent option for users who value ease of use and smooth connection. However, many discover that in terms of complicated data reporting, advanced visualization, and report types, its reports are inferior to those of other Salesforce reporting tools.
Pros
Integration with Salesforce: You may construct Salesforce dashboards without requiring additional data connections thanks to Salesforce's native reporting tool, which interacts with your current Salesforce data.
Usability: Because of its ease of use, both technical and non-technical individuals who work with metrics can utilize it.
Real-time Data: Decision-making and KPI measurement can benefit greatly from instant access to real-time Salesforce data.
Cons
Limited Visualizations: Native Salesforce reporting is less appropriate for comprehensive data analysis since it lacks the sophisticated visualization features provided by third-party solutions.
Limitations on Data Volume: Performance problems with large datasets can result in slower reporting and fewer data exports.
License Restrictions: Salesforce reports will not be accessible to staff members who do not own SFDC (Salesforce Dot Com) licensing. Reports may only be created and sent by Salesforce users, which frequently prompts companies to integrate other reporting solutions.
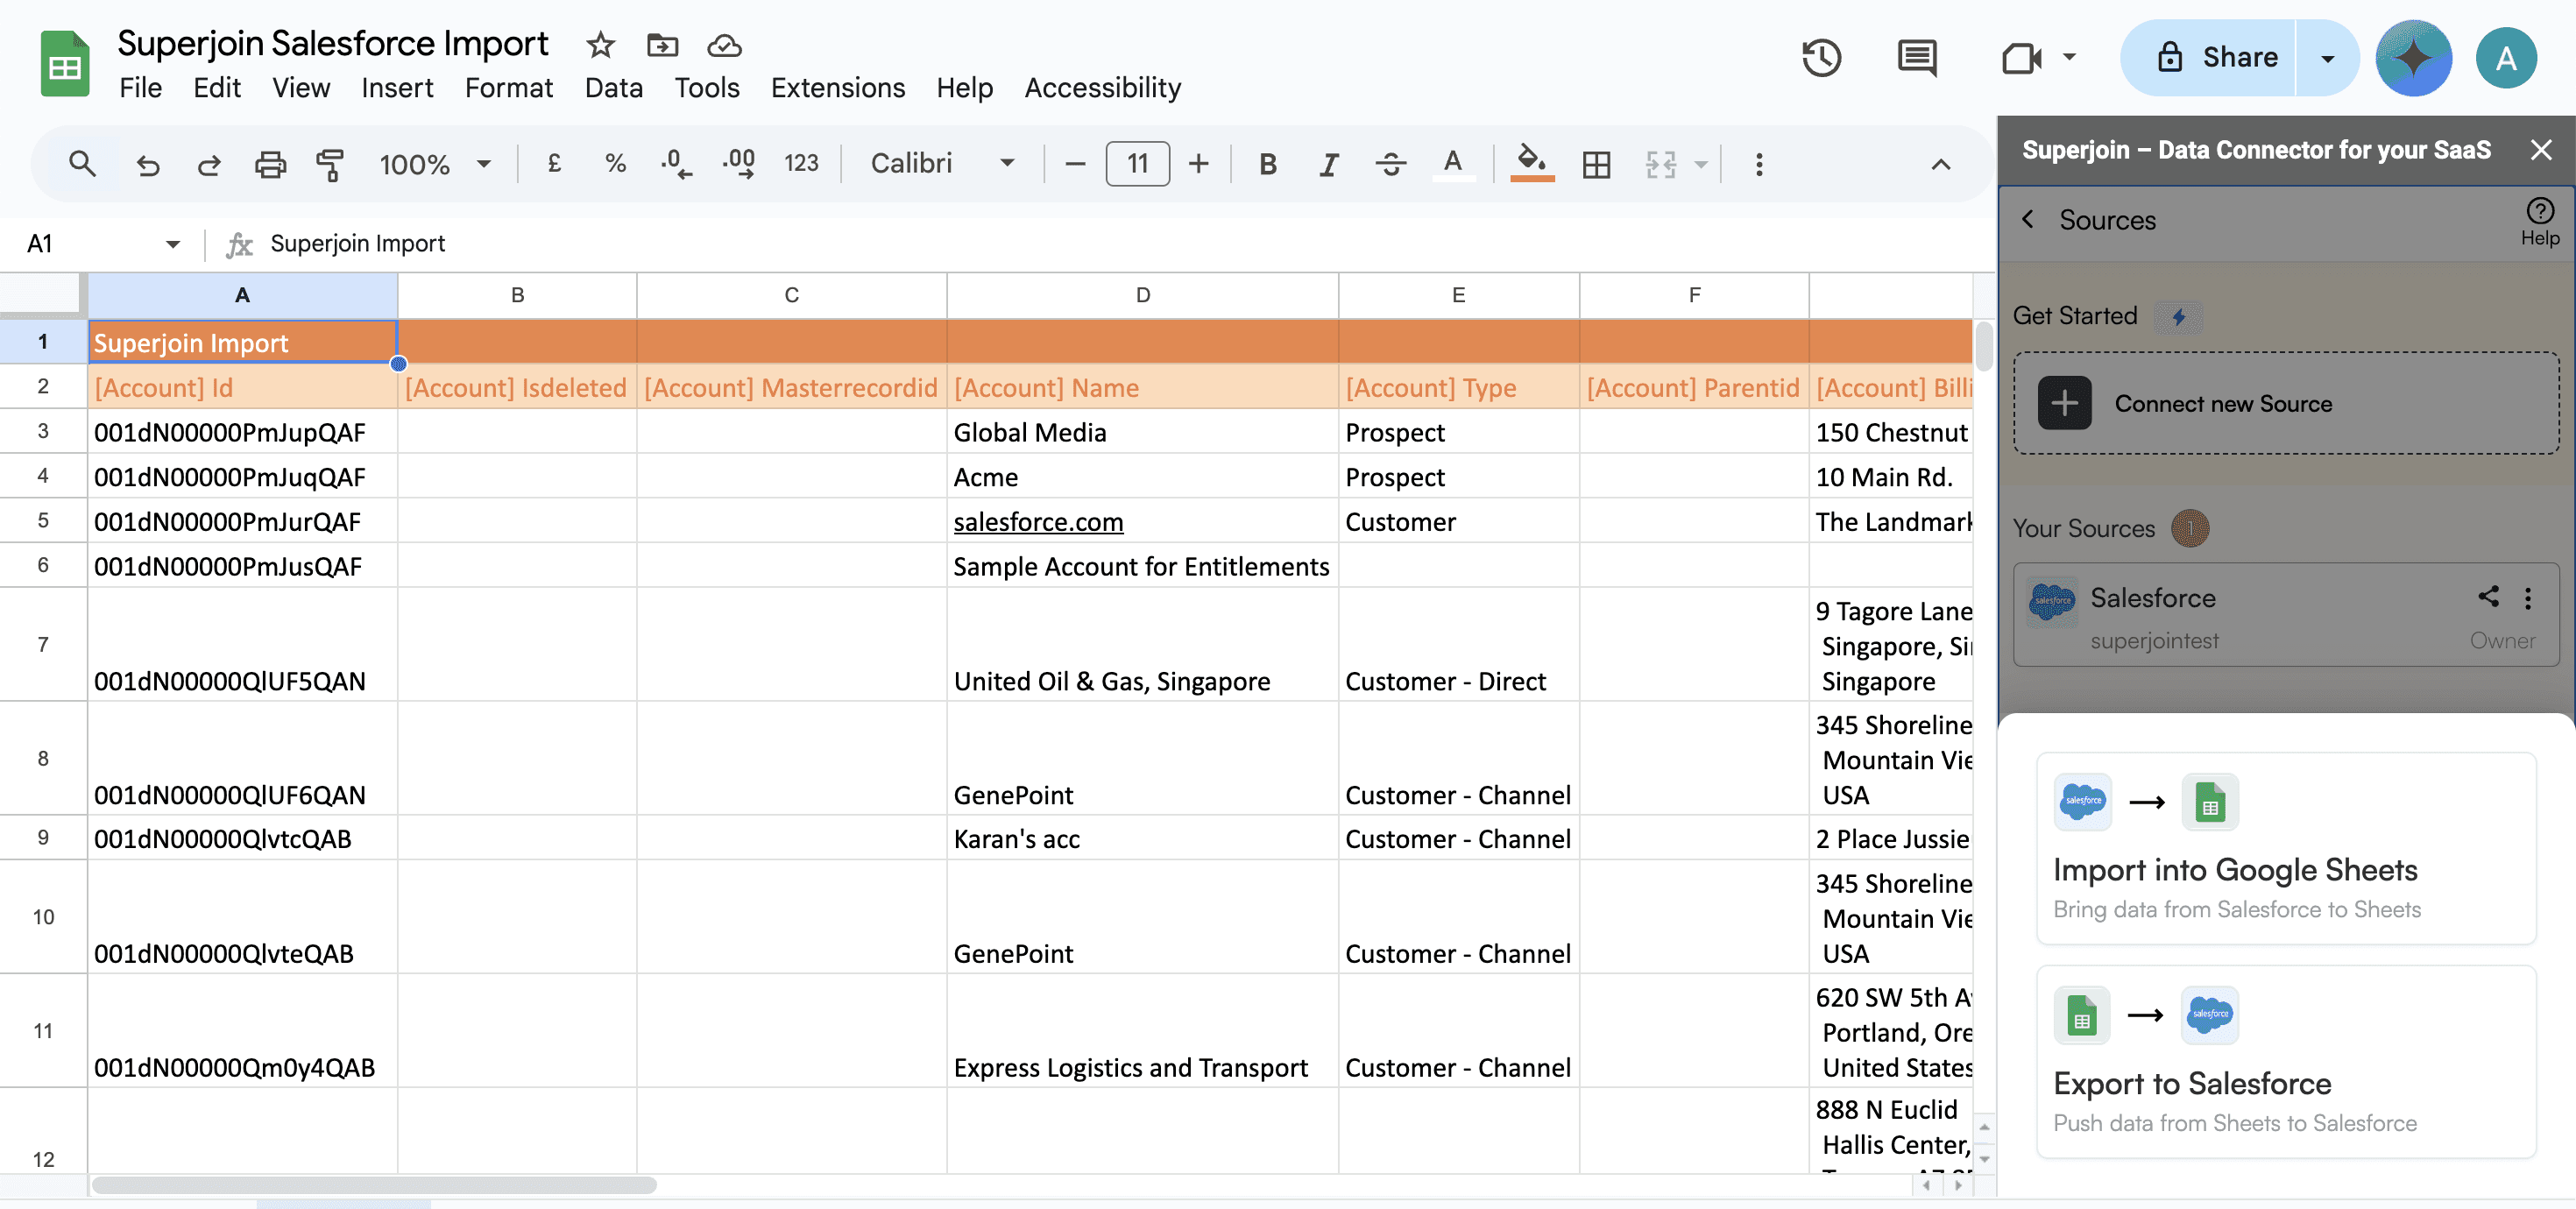
2. Superjoin
Superjoin is unique among Salesforce reporting tools because it combines the efficiency of spreadsheets with the strength of more conventional data analytics programs. Superjoin is a free Google Sheets add-on (Excel add-in) allows you to sync real-time data from your preferred business platforms straight into your spreadsheet.
For people who desire in-depth insights from their data but still enjoy the simplicity of spreadsheets, this is the go-to tool. Additionally, it provides top-notch AI solutions to assist users of all skill levels who are new to spreadsheets in getting started.
Pros
Easy Setup: Whether you're a marketing expert or a data analyst, Superjoin's user-friendly interface guarantees a quick learning curve due to its minimal coding requirements and simple setup.
Customized Data Imports: From your dashboard, you can pick out particular fields, sort and filter them as needed, and then easily sync them to Google Sheets or Microsoft Excel.
Automated Data Syncing: You can program your synced data to refresh automatically. This eliminates the need for frequent manual updates and guarantees that your Google Sheets will always display the most recent data, freeing up your staff to concentrate on more important work.
Cons
User Experience: Superjoin is made to work well with spreadsheet programs. There may be a small learning curve for people who are not as comfortable with spreadsheets. However, Superjoin's AI-powered features make the platform easier to use and more accessible for users of all technical skill levels.
Pricing
With Superjoin, you can import data from any source into Sheets at no cost. For those seeking advanced features, our pricing is set at $79 per user, per month with an annual contract.
3. Tableau
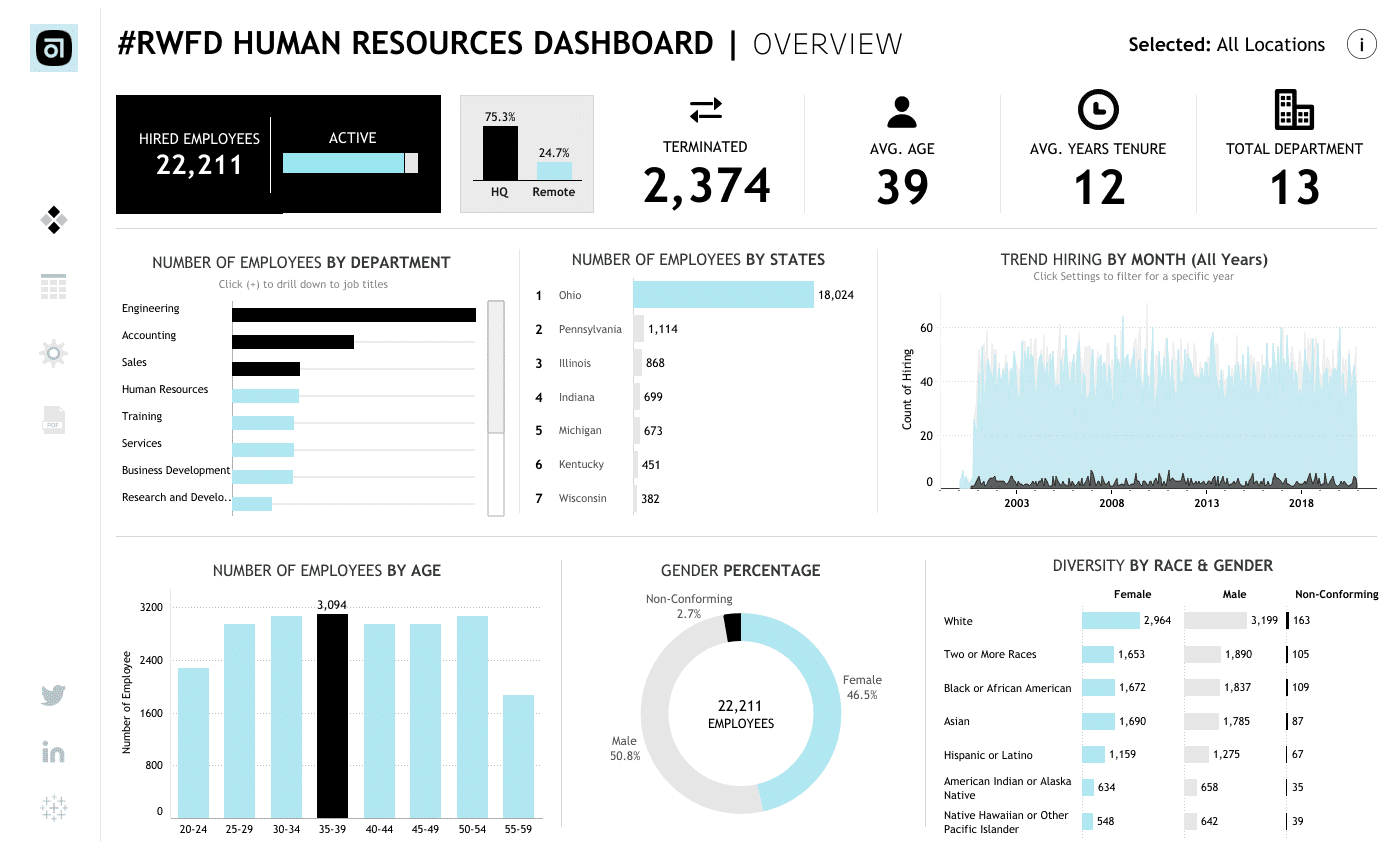
Tableau’s exceptional data visualizations make it a top choice for enterprises willing to invest in its high-end features and functionalities.
Pros
Sturdy Visualization: Tableau is a master of data visualization, providing a vast array of interactive dashboards, graphs, and charts for in-depth data analysis.
Data Blending: This technique enables the integration of data from several sources, offering a comprehensive perspective of company data and enabling deeper insights.
Scalability: Tableau is a good Salesforce reporting tool for businesses with high data requirements since it can manage big datasets and intricate analytical queries.
Cons
Expensive Licensing: For smaller businesses with tighter budgets, Tableau's licensing fees may be unaffordable.
Dependency on Data Engineers: The cost of complex data integrations may increase if data engineers are required to help.
Tableau Cloud: Users must acquire the SaaS version of Tableau Server in order to publish reports and collaborate.
Pricing
Tableau starts at $70 per month per user for a Tableau Creator license.
Note: Add-ons like Superjoin can integrate with Tableau to allow teams to access Tableau data for customer reporting.
4. XL-Connector by Xappex
Although XL-Connector is an easy-to-use Salesforce reporting solution, it might not meet all firms' advanced analytics requirements. It is best suited for organizations seeking basic reporting functionality on important metrics.

Pros
Drag-and-Drop Interface: Users without coding experience can easily create reports with Xappex's user-friendly drag-and-drop interface.
Scheduled Reports: It enables users to plan and automate the creation and dissemination of reports, guaranteeing that important data is delivered on time.
Dashboards That Can Be Customized: XL-Connector gives users the freedom to alter dashboards to fit their own needs and branding.
Cons
Data Syncing Delays: The accuracy of real-time reporting may be impacted by sporadic delays in data syncing with Salesforce.
Limited Advanced Analytics: XL-Connector may not have as many sophisticated analytical features as other tools, even though it is appropriate for routine reporting requirements.
Customer Service: Some users may feel that XL-Connector's customer service is not very helpful or attentive.
Pricing
XL-Connector starts at $99 per user a year. XL-Connector is free to pull and refresh data from Salesforce.
5. Coupler.io
Coupler.io is a Salesforce reporting tool used by reporting teams that work with diverse data sources.

Pros
Simple Data Import: Coupler.io makes it easy to integrate data with Salesforce by streamlining the import of data from several sources.
Customizable Reporting: Users have the ability to alter dashboards and reports to fit their own tastes and professional needs.
Affordability: Coupler.io is frequently less expensive than other advanced Salesforce reporting products.
Cons
Visualization Features: Coupler.io has certain visualization features, although they might not be as comprehensive as those of some other tools available on the market.
Data Volume Restrictions: When working with large datasets, Coupler.io experiences performance problems that slow down the creation of reports.
Complex Reporting: Coupler.io may have a higher learning curve for complex reporting requirements.
Pricing
Coupler.io starts at $19 per person per month for an annual contract.
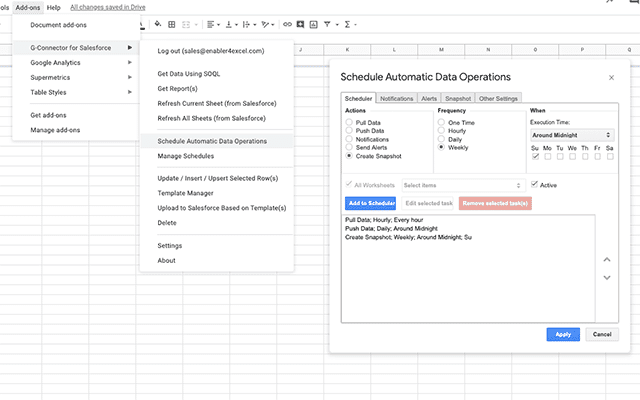
6. G-Connector for Salesforce
G-Connector is a suitable tool for organizations extensively using Google Workspace, providing real-time data sync and workflow automation capabilities.
Pros
Integration with Google Workspace: G-Connector makes it easy to share and collaborate on data by integrating Salesforce data with Google Workspace apps.
Real-time Data Sync: It ensures current reporting by providing real-time data syncing between Google Sheets and Salesforce.
Automated Workflows: By enabling users to automate workflows, G-Connector lowers human labor costs and boosts output.
Cons
Restricted capabilities: G-Connector may offer fewer sophisticated capabilities and visualizations than comparable stand-alone reporting solutions.
Dependency on Google Sheets: Instead of using Google Sheets for analysis, businesses might prefer a specialized reporting program.
Security Issues: When transferring data between systems, there may be compliance standards to meet.
Pricing
G-Connector starts at $99 per user per year.
Conclusion
Every company has different needs and goals when it comes to the wide range of Salesforce reporting options. Superjoin is the best option for people who want the comfort of a spreadsheet for granular-level analysis and a large library of pre-built dashboards for reporting, even if several programs have noteworthy capabilities.
Say Goodbye To Tedious Data Exports! 🚀
Are you tired of spending hours manually exporting CSVs from different tools and importing them into Excel?
Superjoin is a data connector for Excel & Google Sheets that connects your favorite SaaS tools to Excel automatically. You can get data from these platforms into Excel automatically to build reports that update automatically.
Bid farewell to tedious exports and repetitive tasks. With Superjoin, you can add 1 additional day to your week. Try Superjoin for free or schedule a demo.
Salesforce reporting tools have revolutionized how sales managers extract and analyze customer data, sales rep performance, summary reports, and more with the leading Customer Relationship Management (CRM) tool.
There are several powerful, cloud-based reporting tools available on Salesforce AppExchange today, each offering unique features and capabilities. Let’s explore the pros and cons of each tool to understand which one stands out as the best choice for consumers.
1. Native Salesforce Reporting
The Native Salesforce CRM report builder is an excellent option for users who value ease of use and smooth connection. However, many discover that in terms of complicated data reporting, advanced visualization, and report types, its reports are inferior to those of other Salesforce reporting tools.
Pros
Integration with Salesforce: You may construct Salesforce dashboards without requiring additional data connections thanks to Salesforce's native reporting tool, which interacts with your current Salesforce data.
Usability: Because of its ease of use, both technical and non-technical individuals who work with metrics can utilize it.
Real-time Data: Decision-making and KPI measurement can benefit greatly from instant access to real-time Salesforce data.
Cons
Limited Visualizations: Native Salesforce reporting is less appropriate for comprehensive data analysis since it lacks the sophisticated visualization features provided by third-party solutions.
Limitations on Data Volume: Performance problems with large datasets can result in slower reporting and fewer data exports.
License Restrictions: Salesforce reports will not be accessible to staff members who do not own SFDC (Salesforce Dot Com) licensing. Reports may only be created and sent by Salesforce users, which frequently prompts companies to integrate other reporting solutions.
2. Superjoin
Superjoin is unique among Salesforce reporting tools because it combines the efficiency of spreadsheets with the strength of more conventional data analytics programs. Superjoin is a free Google Sheets add-on (Excel add-in) allows you to sync real-time data from your preferred business platforms straight into your spreadsheet.
For people who desire in-depth insights from their data but still enjoy the simplicity of spreadsheets, this is the go-to tool. Additionally, it provides top-notch AI solutions to assist users of all skill levels who are new to spreadsheets in getting started.
Pros
Easy Setup: Whether you're a marketing expert or a data analyst, Superjoin's user-friendly interface guarantees a quick learning curve due to its minimal coding requirements and simple setup.
Customized Data Imports: From your dashboard, you can pick out particular fields, sort and filter them as needed, and then easily sync them to Google Sheets or Microsoft Excel.
Automated Data Syncing: You can program your synced data to refresh automatically. This eliminates the need for frequent manual updates and guarantees that your Google Sheets will always display the most recent data, freeing up your staff to concentrate on more important work.
Cons
User Experience: Superjoin is made to work well with spreadsheet programs. There may be a small learning curve for people who are not as comfortable with spreadsheets. However, Superjoin's AI-powered features make the platform easier to use and more accessible for users of all technical skill levels.
Pricing
With Superjoin, you can import data from any source into Sheets at no cost. For those seeking advanced features, our pricing is set at $79 per user, per month with an annual contract.
3. Tableau
Tableau’s exceptional data visualizations make it a top choice for enterprises willing to invest in its high-end features and functionalities.
Pros
Sturdy Visualization: Tableau is a master of data visualization, providing a vast array of interactive dashboards, graphs, and charts for in-depth data analysis.
Data Blending: This technique enables the integration of data from several sources, offering a comprehensive perspective of company data and enabling deeper insights.
Scalability: Tableau is a good Salesforce reporting tool for businesses with high data requirements since it can manage big datasets and intricate analytical queries.
Cons
Expensive Licensing: For smaller businesses with tighter budgets, Tableau's licensing fees may be unaffordable.
Dependency on Data Engineers: The cost of complex data integrations may increase if data engineers are required to help.
Tableau Cloud: Users must acquire the SaaS version of Tableau Server in order to publish reports and collaborate.
Pricing
Tableau starts at $70 per month per user for a Tableau Creator license.
Note: Add-ons like Superjoin can integrate with Tableau to allow teams to access Tableau data for customer reporting.
4. XL-Connector by Xappex
Although XL-Connector is an easy-to-use Salesforce reporting solution, it might not meet all firms' advanced analytics requirements. It is best suited for organizations seeking basic reporting functionality on important metrics.
Pros
Drag-and-Drop Interface: Users without coding experience can easily create reports with Xappex's user-friendly drag-and-drop interface.
Scheduled Reports: It enables users to plan and automate the creation and dissemination of reports, guaranteeing that important data is delivered on time.
Dashboards That Can Be Customized: XL-Connector gives users the freedom to alter dashboards to fit their own needs and branding.
Cons
Data Syncing Delays: The accuracy of real-time reporting may be impacted by sporadic delays in data syncing with Salesforce.
Limited Advanced Analytics: XL-Connector may not have as many sophisticated analytical features as other tools, even though it is appropriate for routine reporting requirements.
Customer Service: Some users may feel that XL-Connector's customer service is not very helpful or attentive.
Pricing
XL-Connector starts at $99 per user a year. XL-Connector is free to pull and refresh data from Salesforce.
5. Coupler.io
Coupler.io is a Salesforce reporting tool used by reporting teams that work with diverse data sources.
Pros
Simple Data Import: Coupler.io makes it easy to integrate data with Salesforce by streamlining the import of data from several sources.
Customizable Reporting: Users have the ability to alter dashboards and reports to fit their own tastes and professional needs.
Affordability: Coupler.io is frequently less expensive than other advanced Salesforce reporting products.
Cons
Visualization Features: Coupler.io has certain visualization features, although they might not be as comprehensive as those of some other tools available on the market.
Data Volume Restrictions: When working with large datasets, Coupler.io experiences performance problems that slow down the creation of reports.
Complex Reporting: Coupler.io may have a higher learning curve for complex reporting requirements.
Pricing
Coupler.io starts at $19 per person per month for an annual contract.
6. G-Connector for Salesforce
G-Connector is a suitable tool for organizations extensively using Google Workspace, providing real-time data sync and workflow automation capabilities.
Pros
Integration with Google Workspace: G-Connector makes it easy to share and collaborate on data by integrating Salesforce data with Google Workspace apps.
Real-time Data Sync: It ensures current reporting by providing real-time data syncing between Google Sheets and Salesforce.
Automated Workflows: By enabling users to automate workflows, G-Connector lowers human labor costs and boosts output.
Cons
Restricted capabilities: G-Connector may offer fewer sophisticated capabilities and visualizations than comparable stand-alone reporting solutions.
Dependency on Google Sheets: Instead of using Google Sheets for analysis, businesses might prefer a specialized reporting program.
Security Issues: When transferring data between systems, there may be compliance standards to meet.
Pricing
G-Connector starts at $99 per user per year.
Conclusion
Every company has different needs and goals when it comes to the wide range of Salesforce reporting options. Superjoin is the best option for people who want the comfort of a spreadsheet for granular-level analysis and a large library of pre-built dashboards for reporting, even if several programs have noteworthy capabilities.
Say Goodbye To Tedious Data Exports! 🚀
Are you tired of spending hours manually exporting CSVs from different tools and importing them into Excel?
Superjoin is a data connector for Excel & Google Sheets that connects your favorite SaaS tools to Excel automatically. You can get data from these platforms into Excel automatically to build reports that update automatically.
Bid farewell to tedious exports and repetitive tasks. With Superjoin, you can add 1 additional day to your week. Try Superjoin for free or schedule a demo.
FAQs
What are Salesforce reporting tools?
What are Salesforce reporting tools?
Why should I use third-party reporting tools with Salesforce?
Why should I use third-party reporting tools with Salesforce?
How do I choose the best reporting tool for my business?
How do I choose the best reporting tool for my business?
Automatic Data Pulls
Visual Data Preview
Set Alerts

Try it now