Microsoft Excel Tutorial
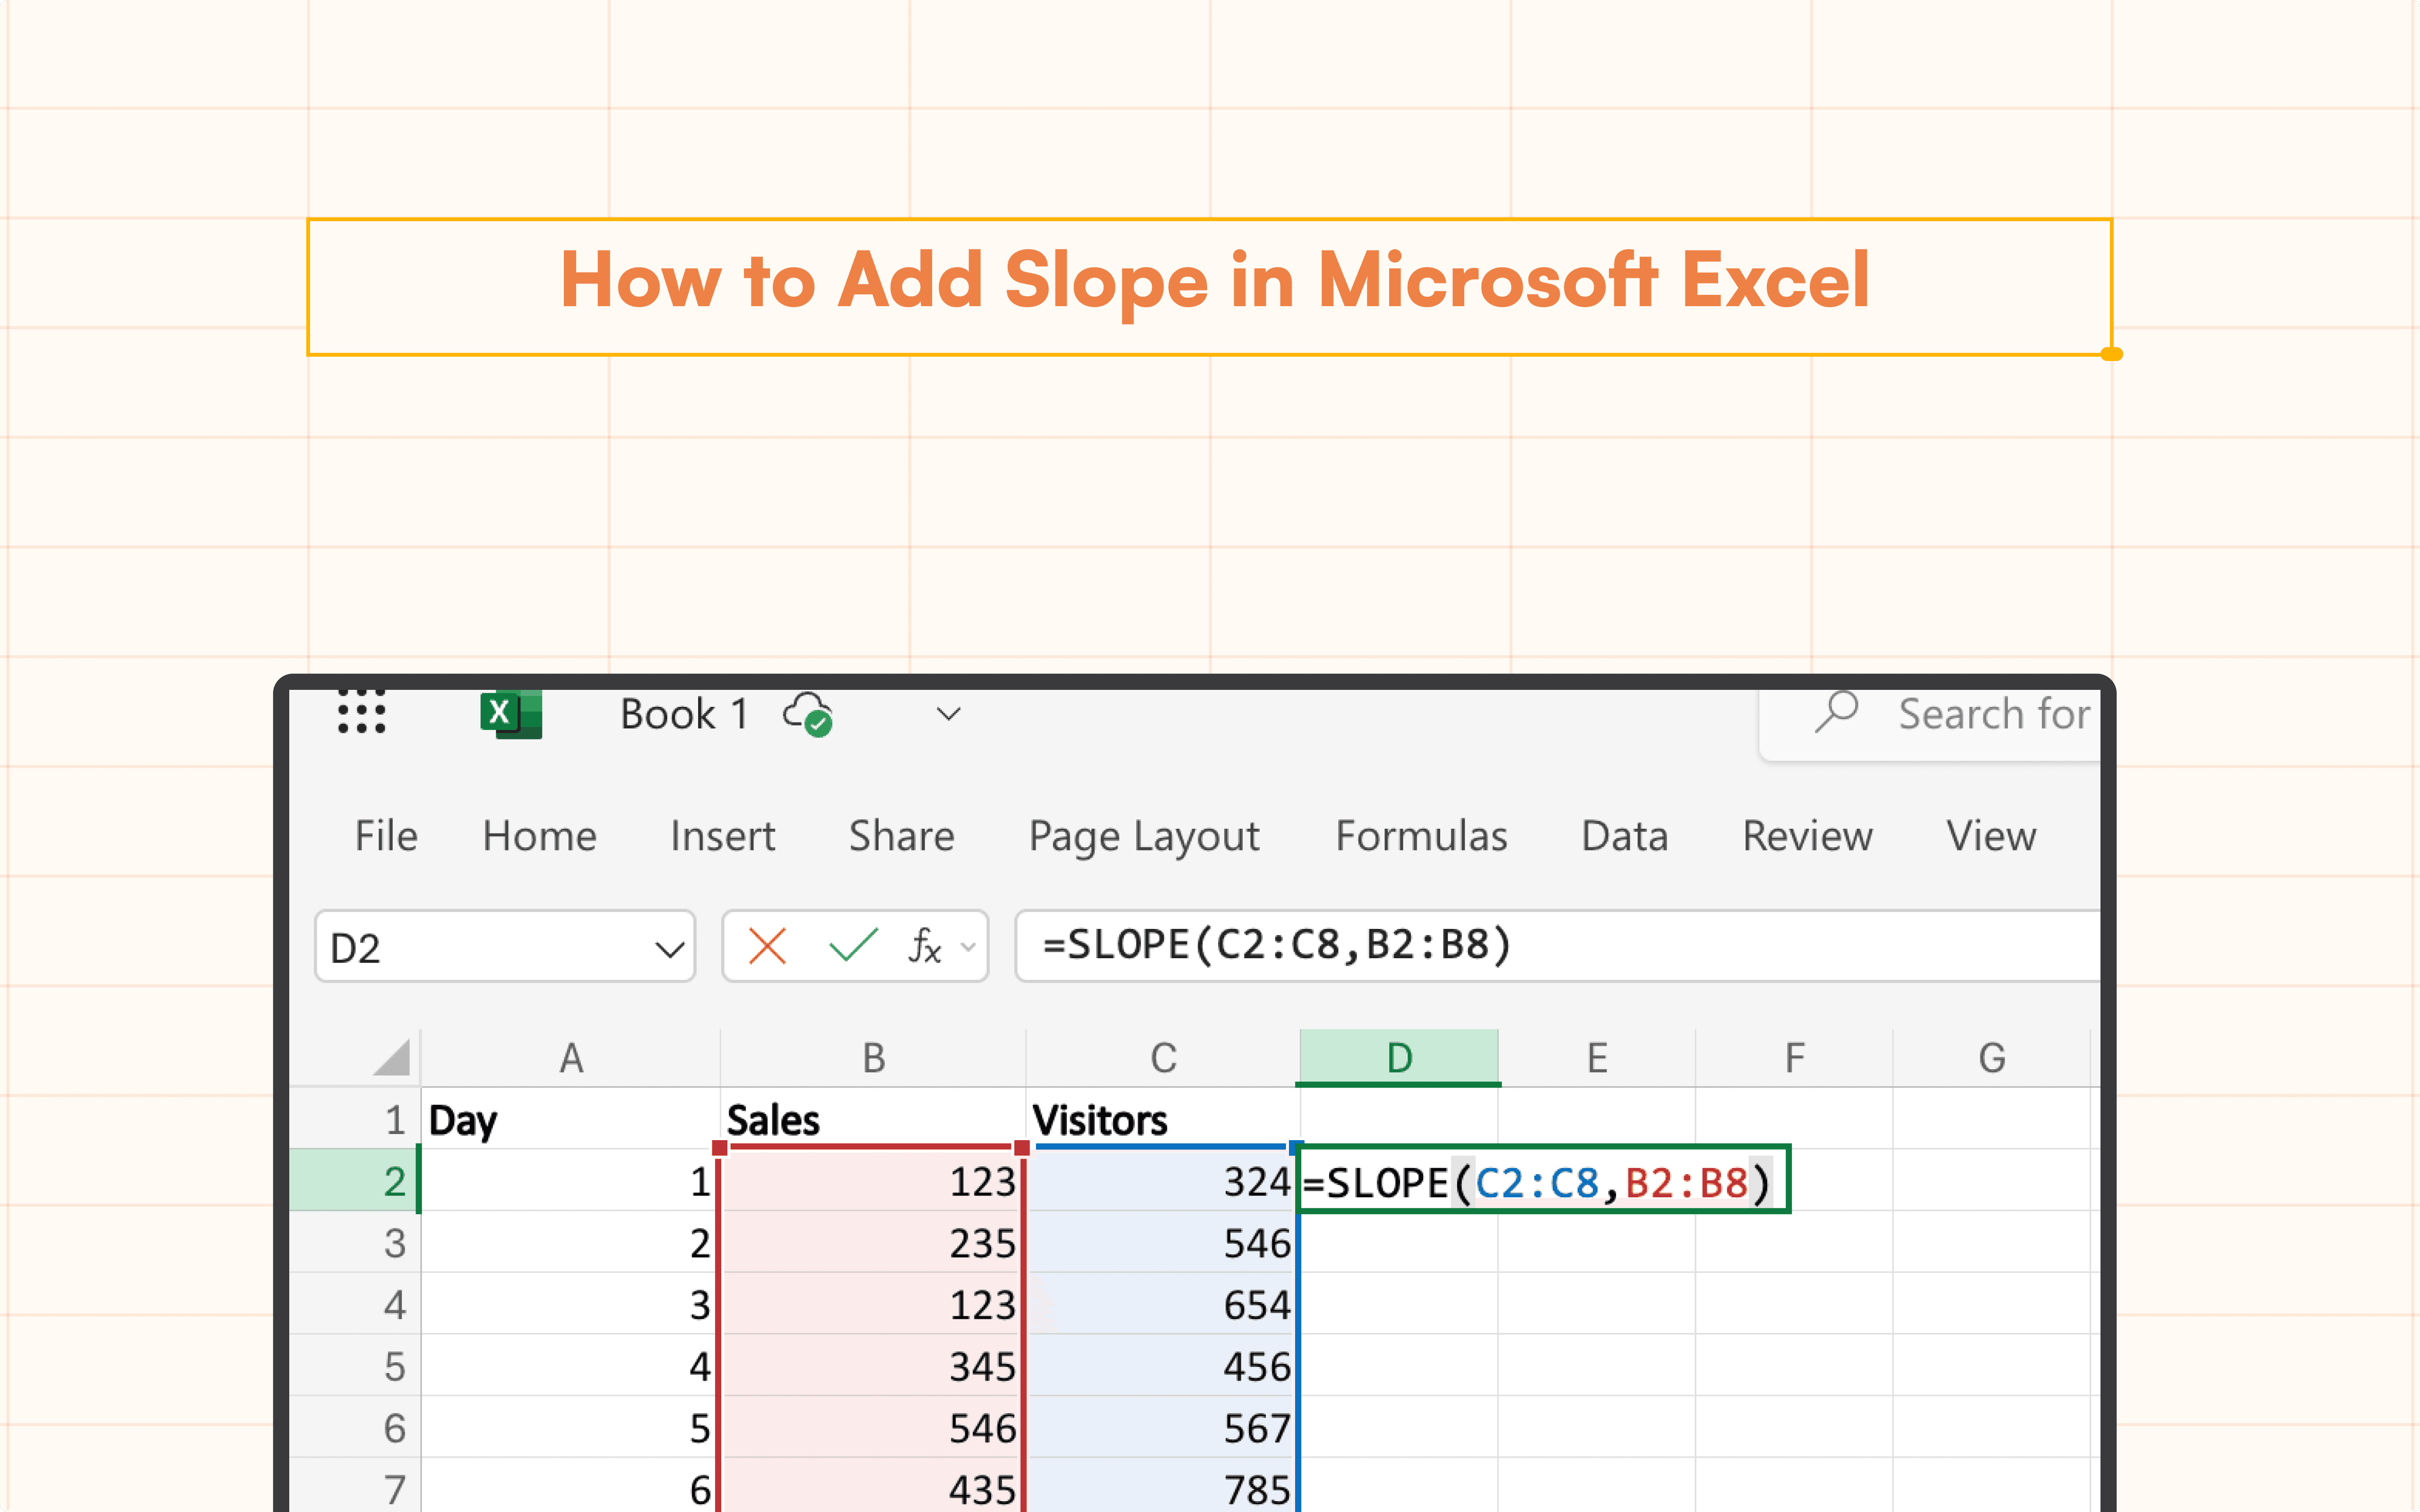
How to Add Slope in Microsoft Excel
Learn how to find slope on Excel with step-by-step instructions, tips, and advanced techniques.
Table of Contents
Whether you're managing big datasets or working on a small project, data analysis is essential to making wise decisions. Understanding trends is one of the core components of data analysis, and figuring out the slope is a crucial component of this.
There are several ways to determine and examine the slope of your data in Excel. To ensure you can fully utilize this effective tool, this post will lead you through the process of finding slope in Excel.
Understanding the Slope
It's critical to comprehend what slope is and its significance before delving into slope calculation techniques. The amount that one variable changes in respect to another is measured by its slope. The rate at which the dependent variable (often the Y-axis) changes in relation to the independent variable (typically the X-axis) is represented by the slope of a line in a graph. This can assist in seeing patterns and formulating forecasts using the data that is already available.
Benefits of Calculating Slope
Understanding how to find slope in Excel can offer several benefits:
Trend Analysis: Helps in identifying trends over time.
Prediction: Enables forecasting future values based on historical data.
Data Interpretation: Simplifies the understanding of relationships between variables.
Decision Making: Supports data-driven decision-making by providing clear insights.
Calculating Slope with the SLOPE Function
The SLOPE function in Excel is a straightforward way to calculate the slope of a dataset. Here’s how you can use it:
Prepare your data: Ensure you have two columns of data, one for the independent variable (X) and one for the dependent variable (Y).
Select a cell where you want the slope to be displayed.
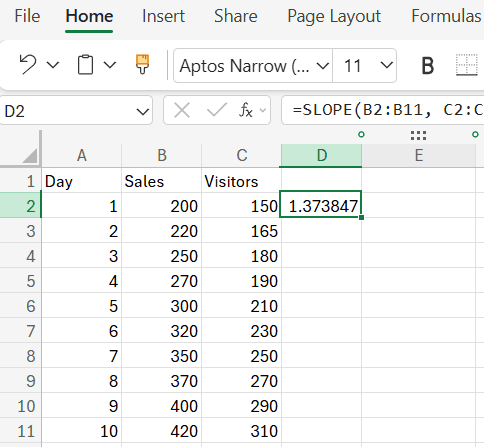
Enter the formula:
=SLOPE(y_values, x_values)
Replace y_values and x_values with the actual range of your data. For example:
=SLOPE(B2:B11, C2:C11)Press Enter, and the slope will be calculated and displayed in the selected cell.
Finding Slope of a Trendline in Microsoft Excel
Another effective method to find the slope is by using the charting feature:
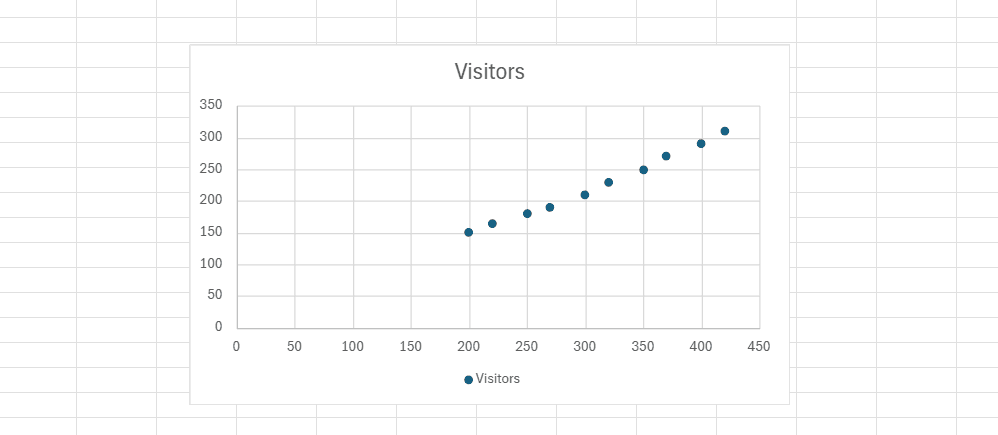
Select your data range: Highlight the data you want to plot.
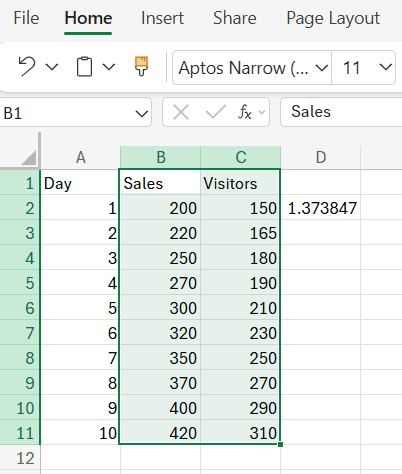
Go to Insert > Chart to create a chart. In the Chart Editor, choose Scatter chart from the Chart type menu.
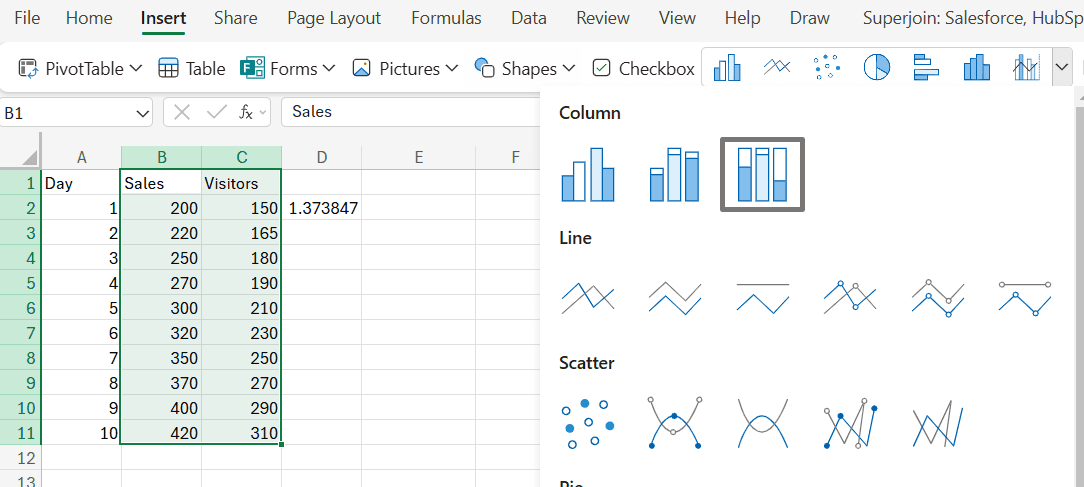
The equation displayed on the chart will be in the form of y = mx + b, where m is the slope of the trendline.
Conclusion
For anyone working with data, knowing how to calculate slope in Excel is a crucial ability. Every technique has its own benefits, whether you employ linear regression, the SLOPE function, or a trendline on a chart. You can improve your data analysis skills and use your data to inform better decisions by becoming proficient in these strategies.
Say Goodbye to Tedious Data Exports! 🚀
Are you tired of the hassle of manually moving data from various tools into Excel? Superjoin has a solution for you.
Superjoin is an Excel add-in that automatically connects your favorite SaaS tools to your spreadsheets. It pulls data directly into Excel, allowing you to create reports that update themselves without any manual work on your part.
Bid farewell to tedious exports and repetitive tasks. With Superjoin, you can add one additional day to your week. Try Superjoin for free or schedule a demo.
Whether you're managing big datasets or working on a small project, data analysis is essential to making wise decisions. Understanding trends is one of the core components of data analysis, and figuring out the slope is a crucial component of this.
There are several ways to determine and examine the slope of your data in Excel. To ensure you can fully utilize this effective tool, this post will lead you through the process of finding slope in Excel.
Understanding the Slope
It's critical to comprehend what slope is and its significance before delving into slope calculation techniques. The amount that one variable changes in respect to another is measured by its slope. The rate at which the dependent variable (often the Y-axis) changes in relation to the independent variable (typically the X-axis) is represented by the slope of a line in a graph. This can assist in seeing patterns and formulating forecasts using the data that is already available.
Benefits of Calculating Slope
Understanding how to find slope in Excel can offer several benefits:
Trend Analysis: Helps in identifying trends over time.
Prediction: Enables forecasting future values based on historical data.
Data Interpretation: Simplifies the understanding of relationships between variables.
Decision Making: Supports data-driven decision-making by providing clear insights.
Calculating Slope with the SLOPE Function
The SLOPE function in Excel is a straightforward way to calculate the slope of a dataset. Here’s how you can use it:
Prepare your data: Ensure you have two columns of data, one for the independent variable (X) and one for the dependent variable (Y).
Select a cell where you want the slope to be displayed.
Enter the formula:
=SLOPE(y_values, x_values)
Replace y_values and x_values with the actual range of your data. For example:
=SLOPE(B2:B11, C2:C11)Press Enter, and the slope will be calculated and displayed in the selected cell.
Finding Slope of a Trendline in Microsoft Excel
Another effective method to find the slope is by using the charting feature:
Select your data range: Highlight the data you want to plot.
Go to Insert > Chart to create a chart. In the Chart Editor, choose Scatter chart from the Chart type menu.
The equation displayed on the chart will be in the form of y = mx + b, where m is the slope of the trendline.
Conclusion
For anyone working with data, knowing how to calculate slope in Excel is a crucial ability. Every technique has its own benefits, whether you employ linear regression, the SLOPE function, or a trendline on a chart. You can improve your data analysis skills and use your data to inform better decisions by becoming proficient in these strategies.
Say Goodbye to Tedious Data Exports! 🚀
Are you tired of the hassle of manually moving data from various tools into Excel? Superjoin has a solution for you.
Superjoin is an Excel add-in that automatically connects your favorite SaaS tools to your spreadsheets. It pulls data directly into Excel, allowing you to create reports that update themselves without any manual work on your part.
Bid farewell to tedious exports and repetitive tasks. With Superjoin, you can add one additional day to your week. Try Superjoin for free or schedule a demo.
FAQs
How do I find the slope of a line in Excel using charting?
How do I find the slope of a line in Excel using charting?
Can I automate slope calculations in Excel?
Can I automate slope calculations in Excel?
Automatic Data Pulls
Visual Data Preview
Set Alerts
other related blogs

Try it now