Hubspot
How to Perform a HubSpot Lead Source Analysis in Excel?
This blog explores how to use Excel, a well-known and easily available software, to conduct a thorough HubSpot lead source analysis.
Table of Contents
For every marketer, knowing where your leads originate from is essential. By examining your HubSpot lead sources, you can determine which channels are generating the best qualified leads, maximize your marketing expenditures, and eventually increase your return on investment. This post explores how to use Excel, a well-known and easily available software, to conduct a thorough HubSpot lead source analysis.
Why Analyze Lead Sources?
HubSpot's lead source functionality tracks the origin of your leads, providing valuable insights into your marketing channels' effectiveness. Analyzing this data unlocks a treasure trove of benefits:
Find Top Performing Channels: You can focus on effective tactics by identifying the channels that are producing the most leads and the best quality leads.
Optimize Campaigns: To increase campaigns' capacity to generate leads, identify ineffective channels and modify them.
Track ROI: Examine the cost per lead (CPL) and conversion rates to determine the return on investment for every marketing channel.
Budget Allocation: Strategically allocate your marketing budget, giving the outlets that generate the most leads more resources.
Your data analysis can also be expanded by combining Pipedrive and Excel with other CRM applications. You may get a more comprehensive understanding of your lead generation efforts by integrating lead sources from several platforms, like HubSpot and Pipedrive. This will enable you to analyze your leads' origins and performance in greater detail.
The Potential of Pivot Tables for Lead Source Analysis
Consider a sizable spreadsheet filled with HubSpot lead source data in rows and columns. Finding patterns and trends in the raw data can be intimidating, even when it contains valuable information. Pivot tables are useful in this situation.
When examining your HubSpot lead source data, pivot tables can be quite helpful in the following ways:
Finding Top Performing Channels: By putting "Lead Source" in rows and the relevant metric (count, sum) in the values section, you can quickly identify which lead sources produce the most leads, qualified leads (MQLs), or customers.
Comparing Conversion Rates: Put "Lead Source" in rows and use the conversion rate formula (COUNT(converted leads) / COUNT(total leads)) in the values section to examine conversion rates from various lead sources. This rapidly identifies the sources that produce the most likely-to-convert leads.
Exploring Further for Deeper Understanding: The interactivity of pivot tables is what makes them so beautiful. To drill down and view the underlying data for a given combination of row and column values, double-click on a cell in the pivot table. This enables you to investigate patterns within particular lead sources.
Guide to HubSpot Lead Source Analysis in Excel using Pivot Tables
1. Exporting Data from HubSpot
Use Superjoin to extract data from HubSpot to Microsoft Excel. Superjoin is a free Excel add-in that enables you to link your business platforms to Excel, enabling you to import live data directly into your spreadsheet.
To begin, we'll need to install Superjoin.
Install Superjoin
Step 1: Install Superjoin on Microsoft Excel and data import from Hubspot. To install on Excel,
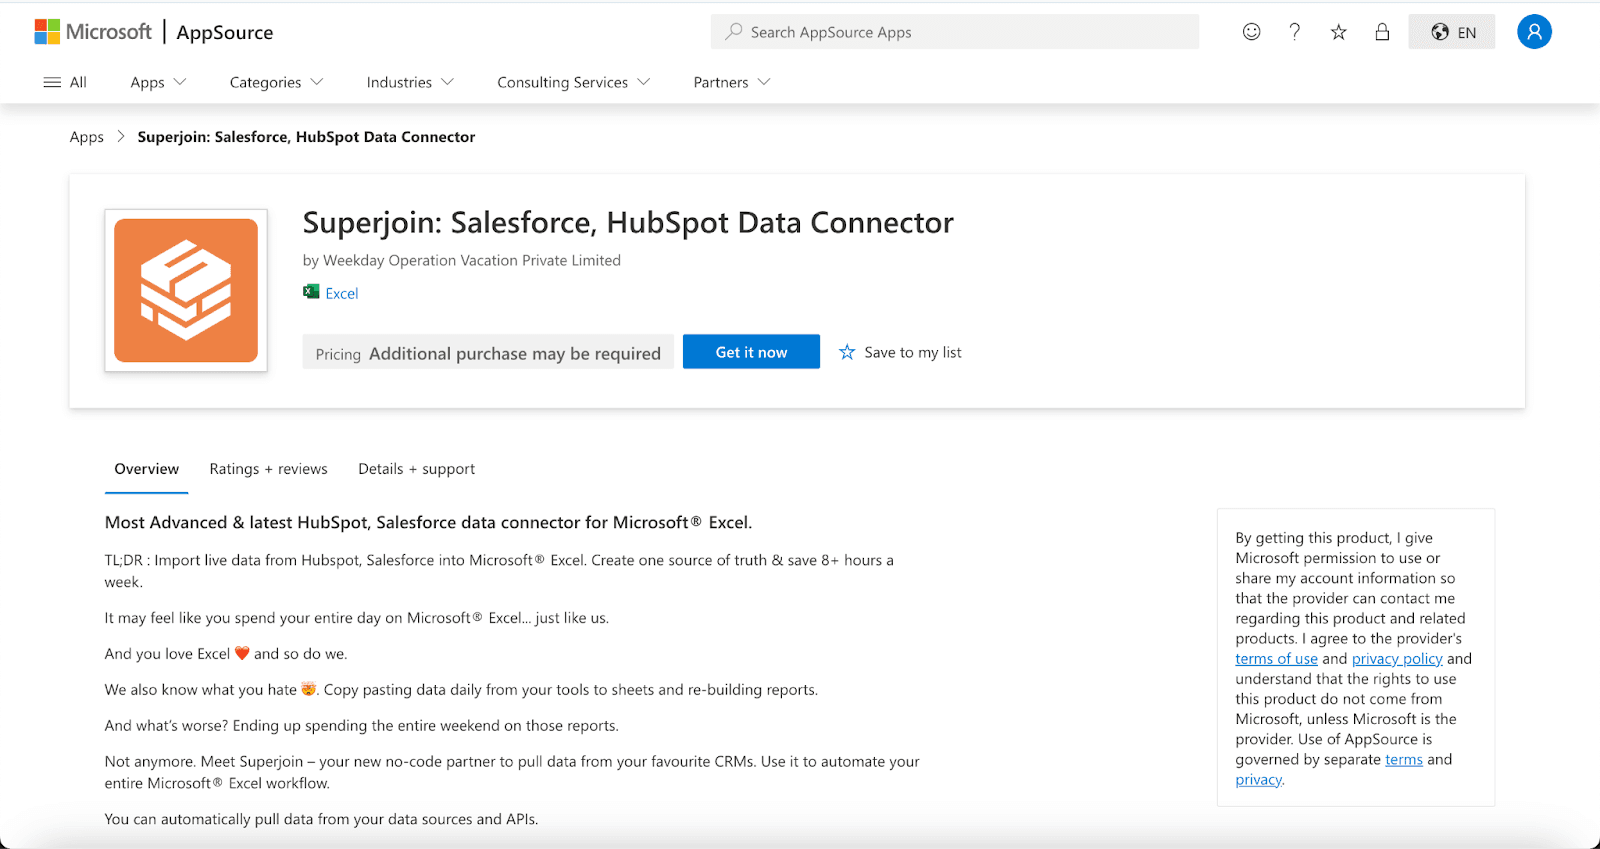
Open this link, click on Get it now.
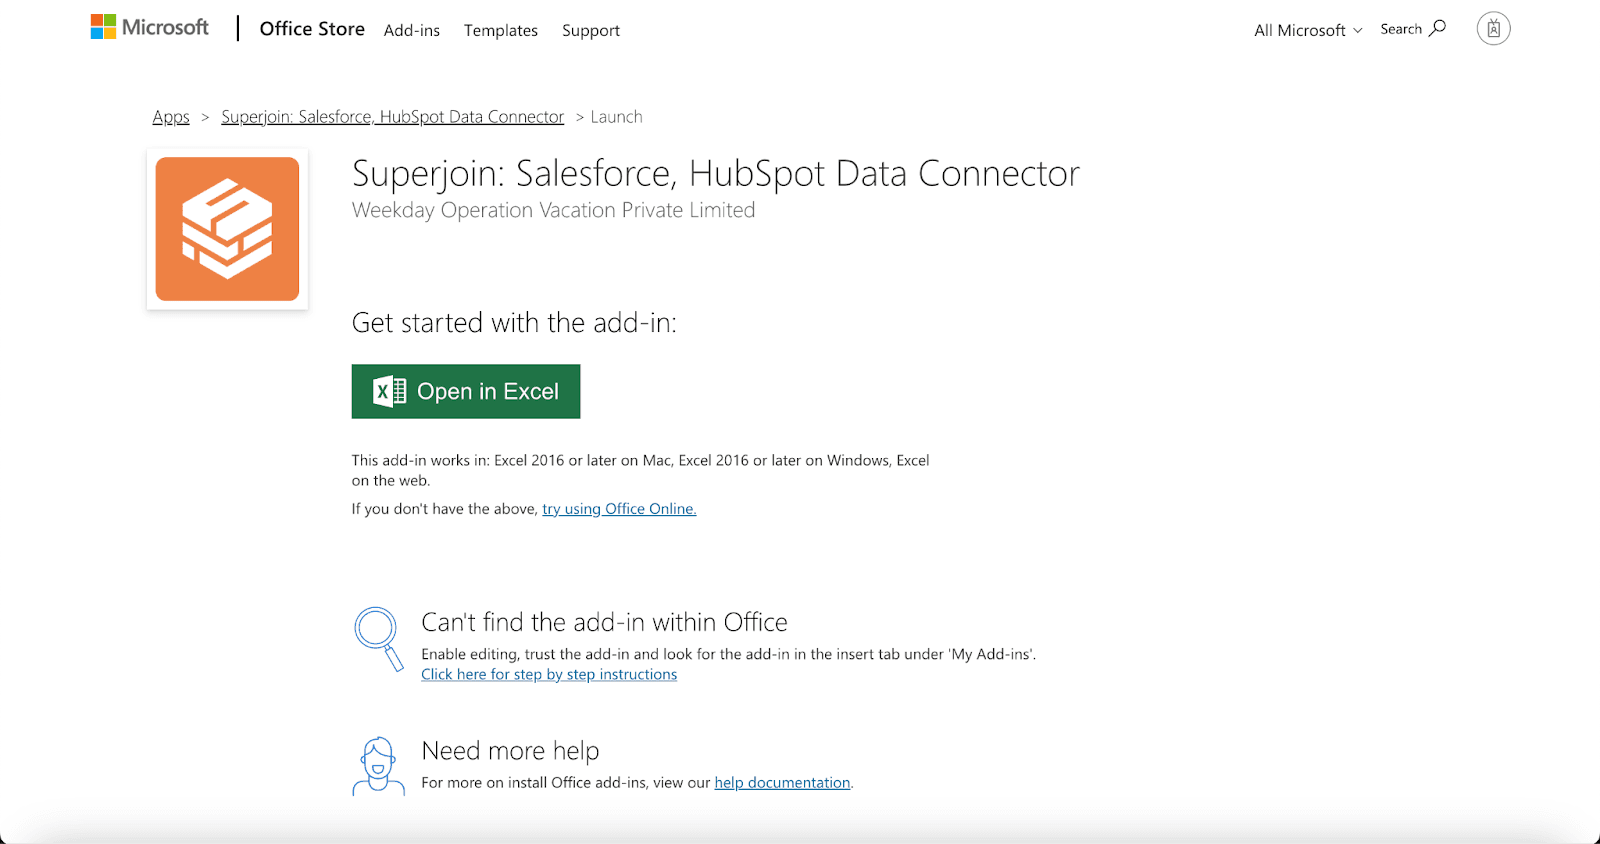
Once installed, click on Open in Excel or Try using it online (for Excel online).
Launch Superjoin by opening the add-in and clicking on Open Sidebar. Login with your Microsoft account to start using Superjoin.

Connect Superjoin to HubSpot and Import Data
Step 2: Select HubSpot as the Data Source
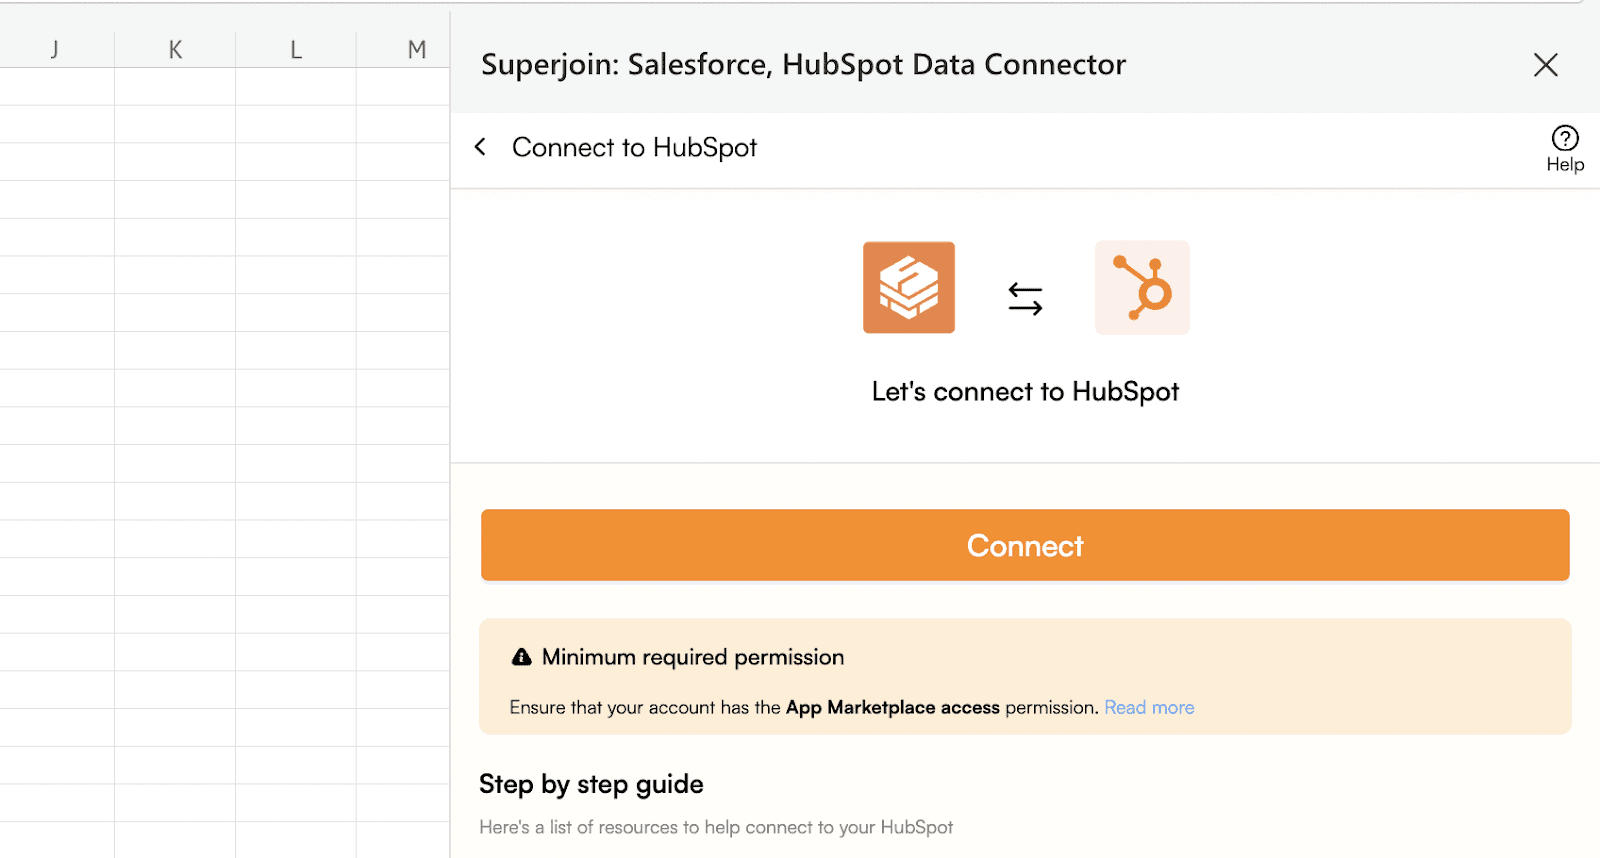
Click on Sources. Choose HubSpot as the data source.

Click on Connect to connect to your HubSpot account and follow the on-screen instructions.
Step 3: Import Data from HubSpot to Microsoft Excel
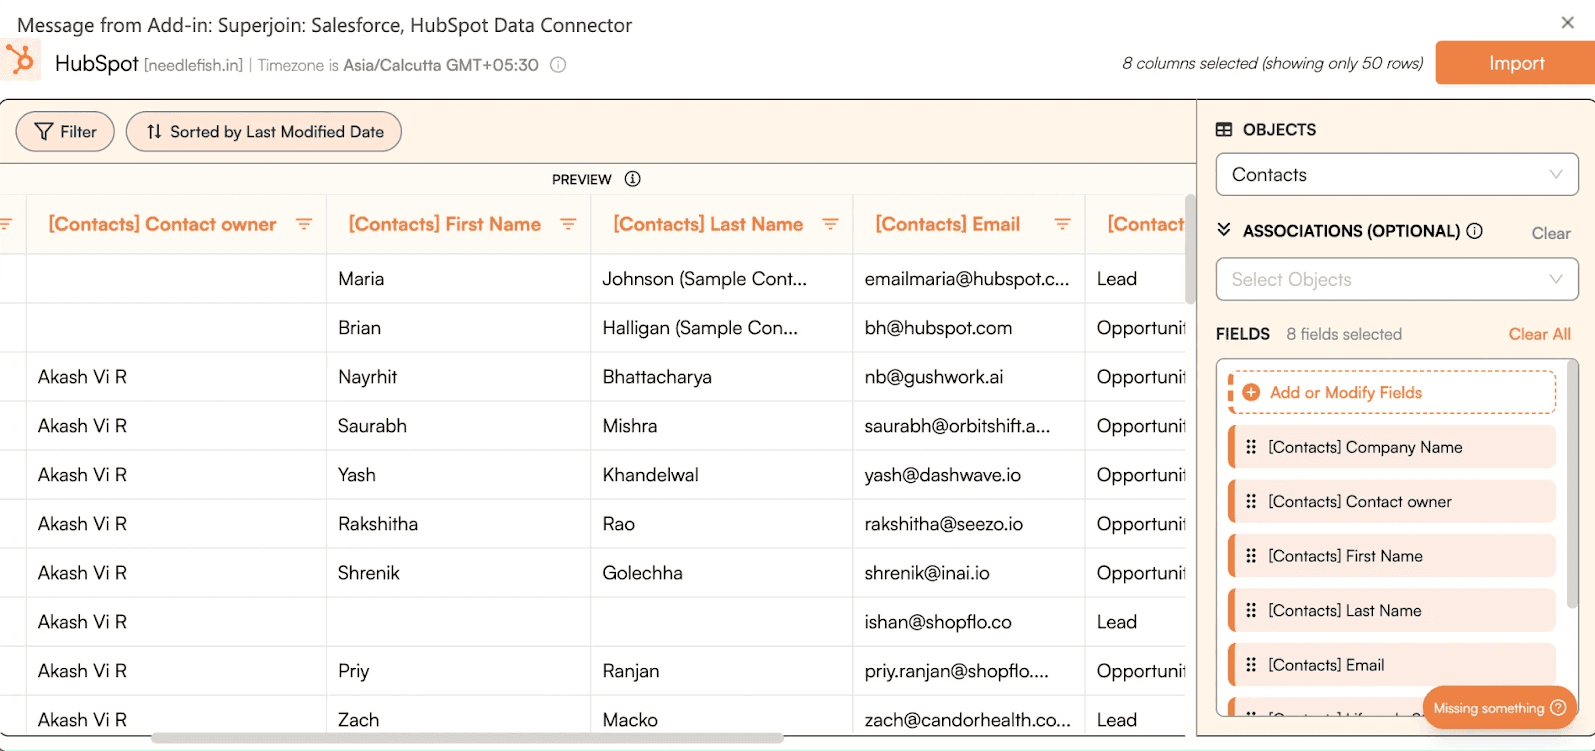
Select the data objects you want to import from HubSpot, such as Deals, Contacts, or other relevant information, and click on Import.
Step 4: Set Up Automatic Sync
Set up automatic sync between HubSpot and Microsoft Excel. Set it to auto-refresh on a schedule.

That’s it. This will also make sure that your data stays up-to-date.
2. Clean Up and Organize
Cleaning up the imported data may be necessary. Make that data types are consistent (e.g., dates formatted correctly) and eliminate any extraneous rows or columns.
Get Your Data Ready: Make sure your dataset has the right headers and is arranged in a tabular fashion. Headers like "Lead ID," "Lead Source," "Lead Status," "Conversion Date," and "Conversion Amount" are present in this instance.
3. Identify Lead Sources
To determine the various sources from which leads are created, look at the "Lead Source" column. The primary sources in our dataset include referrals, emails, social media, and websites.
4. Pivot Tables
Pivot tables are a powerful feature in Excel Sheets for summarizing data.
Create a Pivot Table: Go to `Insert > Pivot table.

Select Data Range: Choose the range of your data.

Customise data accordingly - Here in the pivot table we can customise data based on what we want to view.
5. Visualizing Data with Charts
Visual displays can simplify complex data for better comprehension.
Step 1: Creating a Chart
Select the data you want to visualize, then go to 'Insert > Chart'.
Step 2: Choosing the Right Chart
Step 3: Customizing the Chart. Use the chart editor to customize your chart’s appearance, adding titles, labels, and adjusting colors.
6. Analyze and Interpret
With your data cleaned and organized, analyze the results. Look for trends in lead generation across different channels.
Identify the top channels in terms of lead quantity and quality (consider conversion rates).
7. Visualize Your Findings
Visual aids such as charts and graphs are effective instruments for illustrating your discoveries. Excel offers a variety of chart options, like bar charts or pie charts, to visually represent your lead source data.
Create clear and concise charts highlighting key takeaways, such as the top lead channels or the distribution of leads across different sources.
8. Actionable Insights
Based on your analysis, formulate actionable insights to optimize your marketing strategy.
Consider allocating more resources to high-performing channels.
Develop strategies to improve the effectiveness of underperforming channels.
Track the impact of these changes over time by repeating the analysis at regular intervals.
Advanced Tips and Techniques
This guide has equipped you with the essential tools and knowledge to perform a comprehensive HubSpot lead source analysis in Excel. Now, let's explore some advanced tips and techniques to elevate your analysis and gain even deeper insights:
Leveraging Third-party Integrations
The Excel ecosystem offers a vast array of add-ons that can further enhance your lead source analysis:
Data Visualisation Tools: To create even more intricate and dynamic charts and visualisations within your dashboard, look at add-ons like "Chartify" or "Plotly".
Data Storytelling Tools: To turn raw data into engaging tales for stakeholders, take into consideration add-ons like "Narrative Science" or "Grow with Excel" that create data-driven narratives and reports.
Data Extraction Tools: To automate the import of data from several connectors, such as HubSpot and Chargebee, use programs like Superjoin.
Integration of Marketing Analytics: Look at add-ons that let you import data from other marketing analytics platforms, such as Facebook Ads or Excel Analytics, in addition to your HubSpot data. This gives you a comprehensive picture of how well your marketing is working across all platforms.
Advanced Segmentation Strategies
Lead Scoring Integration: Take into account including lead score information in your analysis if you use HubSpot's lead scoring feature. This enables you to evaluate lead source performance in terms of lead quality and segment leads according to their score.
Time-based Segmentation: Examine the performance of lead sources across various time periods (weekdays versus weekends, months, quarters, etc.). This might highlight seasonal patterns or pinpoint particular periods of time when particular lead sources are more effective.
Campaign-specific Segmentation: Don't merely analyze high-level sources. Segment leads by certain marketing campaigns inside each source by using UTM parameters or campaign tags in your HubSpot data. This enables you to identify areas for improvement as well as the most successful campaigns inside each channel.
Conclusion
By performing a comprehensive HubSpot lead source analysis in Excel, you gain valuable insights into the effectiveness of your marketing efforts. This empowers you to make data-driven decisions, optimize your campaigns, and ultimately achieve
Say goodbye to tedious data exports! 🚀
Are you tired of spending hours manually exporting CSVs from different tools and importing them into Excel?
Superjoin is a data connector for Excel & Google Sheets that connects your favorite SaaS tools to Excel automatically. You can get data from these platforms into Excel automatically to build reports that update automatically.
Bid farewell to tedious exports and repetitive tasks. With Superjoin, you can add 1 additional day to your week. Try Superjoin out for free or schedule a demo.
For every marketer, knowing where your leads originate from is essential. By examining your HubSpot lead sources, you can determine which channels are generating the best qualified leads, maximize your marketing expenditures, and eventually increase your return on investment. This post explores how to use Excel, a well-known and easily available software, to conduct a thorough HubSpot lead source analysis.
Why Analyze Lead Sources?
HubSpot's lead source functionality tracks the origin of your leads, providing valuable insights into your marketing channels' effectiveness. Analyzing this data unlocks a treasure trove of benefits:
Find Top Performing Channels: You can focus on effective tactics by identifying the channels that are producing the most leads and the best quality leads.
Optimize Campaigns: To increase campaigns' capacity to generate leads, identify ineffective channels and modify them.
Track ROI: Examine the cost per lead (CPL) and conversion rates to determine the return on investment for every marketing channel.
Budget Allocation: Strategically allocate your marketing budget, giving the outlets that generate the most leads more resources.
Your data analysis can also be expanded by combining Pipedrive and Excel with other CRM applications. You may get a more comprehensive understanding of your lead generation efforts by integrating lead sources from several platforms, like HubSpot and Pipedrive. This will enable you to analyze your leads' origins and performance in greater detail.
The Potential of Pivot Tables for Lead Source Analysis
Consider a sizable spreadsheet filled with HubSpot lead source data in rows and columns. Finding patterns and trends in the raw data can be intimidating, even when it contains valuable information. Pivot tables are useful in this situation.
When examining your HubSpot lead source data, pivot tables can be quite helpful in the following ways:
Finding Top Performing Channels: By putting "Lead Source" in rows and the relevant metric (count, sum) in the values section, you can quickly identify which lead sources produce the most leads, qualified leads (MQLs), or customers.
Comparing Conversion Rates: Put "Lead Source" in rows and use the conversion rate formula (COUNT(converted leads) / COUNT(total leads)) in the values section to examine conversion rates from various lead sources. This rapidly identifies the sources that produce the most likely-to-convert leads.
Exploring Further for Deeper Understanding: The interactivity of pivot tables is what makes them so beautiful. To drill down and view the underlying data for a given combination of row and column values, double-click on a cell in the pivot table. This enables you to investigate patterns within particular lead sources.
Guide to HubSpot Lead Source Analysis in Excel using Pivot Tables
1. Exporting Data from HubSpot
Use Superjoin to extract data from HubSpot to Microsoft Excel. Superjoin is a free Excel add-in that enables you to link your business platforms to Excel, enabling you to import live data directly into your spreadsheet.
To begin, we'll need to install Superjoin.
Install Superjoin
Step 1: Install Superjoin on Microsoft Excel and data import from Hubspot. To install on Excel,
Open this link, click on Get it now.
Once installed, click on Open in Excel or Try using it online (for Excel online).
Launch Superjoin by opening the add-in and clicking on Open Sidebar. Login with your Microsoft account to start using Superjoin.
Connect Superjoin to HubSpot and Import Data
Step 2: Select HubSpot as the Data Source
Click on Sources. Choose HubSpot as the data source.
Click on Connect to connect to your HubSpot account and follow the on-screen instructions.
Step 3: Import Data from HubSpot to Microsoft Excel
Select the data objects you want to import from HubSpot, such as Deals, Contacts, or other relevant information, and click on Import.
Step 4: Set Up Automatic Sync
Set up automatic sync between HubSpot and Microsoft Excel. Set it to auto-refresh on a schedule.
That’s it. This will also make sure that your data stays up-to-date.
2. Clean Up and Organize
Cleaning up the imported data may be necessary. Make that data types are consistent (e.g., dates formatted correctly) and eliminate any extraneous rows or columns.
Get Your Data Ready: Make sure your dataset has the right headers and is arranged in a tabular fashion. Headers like "Lead ID," "Lead Source," "Lead Status," "Conversion Date," and "Conversion Amount" are present in this instance.
3. Identify Lead Sources
To determine the various sources from which leads are created, look at the "Lead Source" column. The primary sources in our dataset include referrals, emails, social media, and websites.
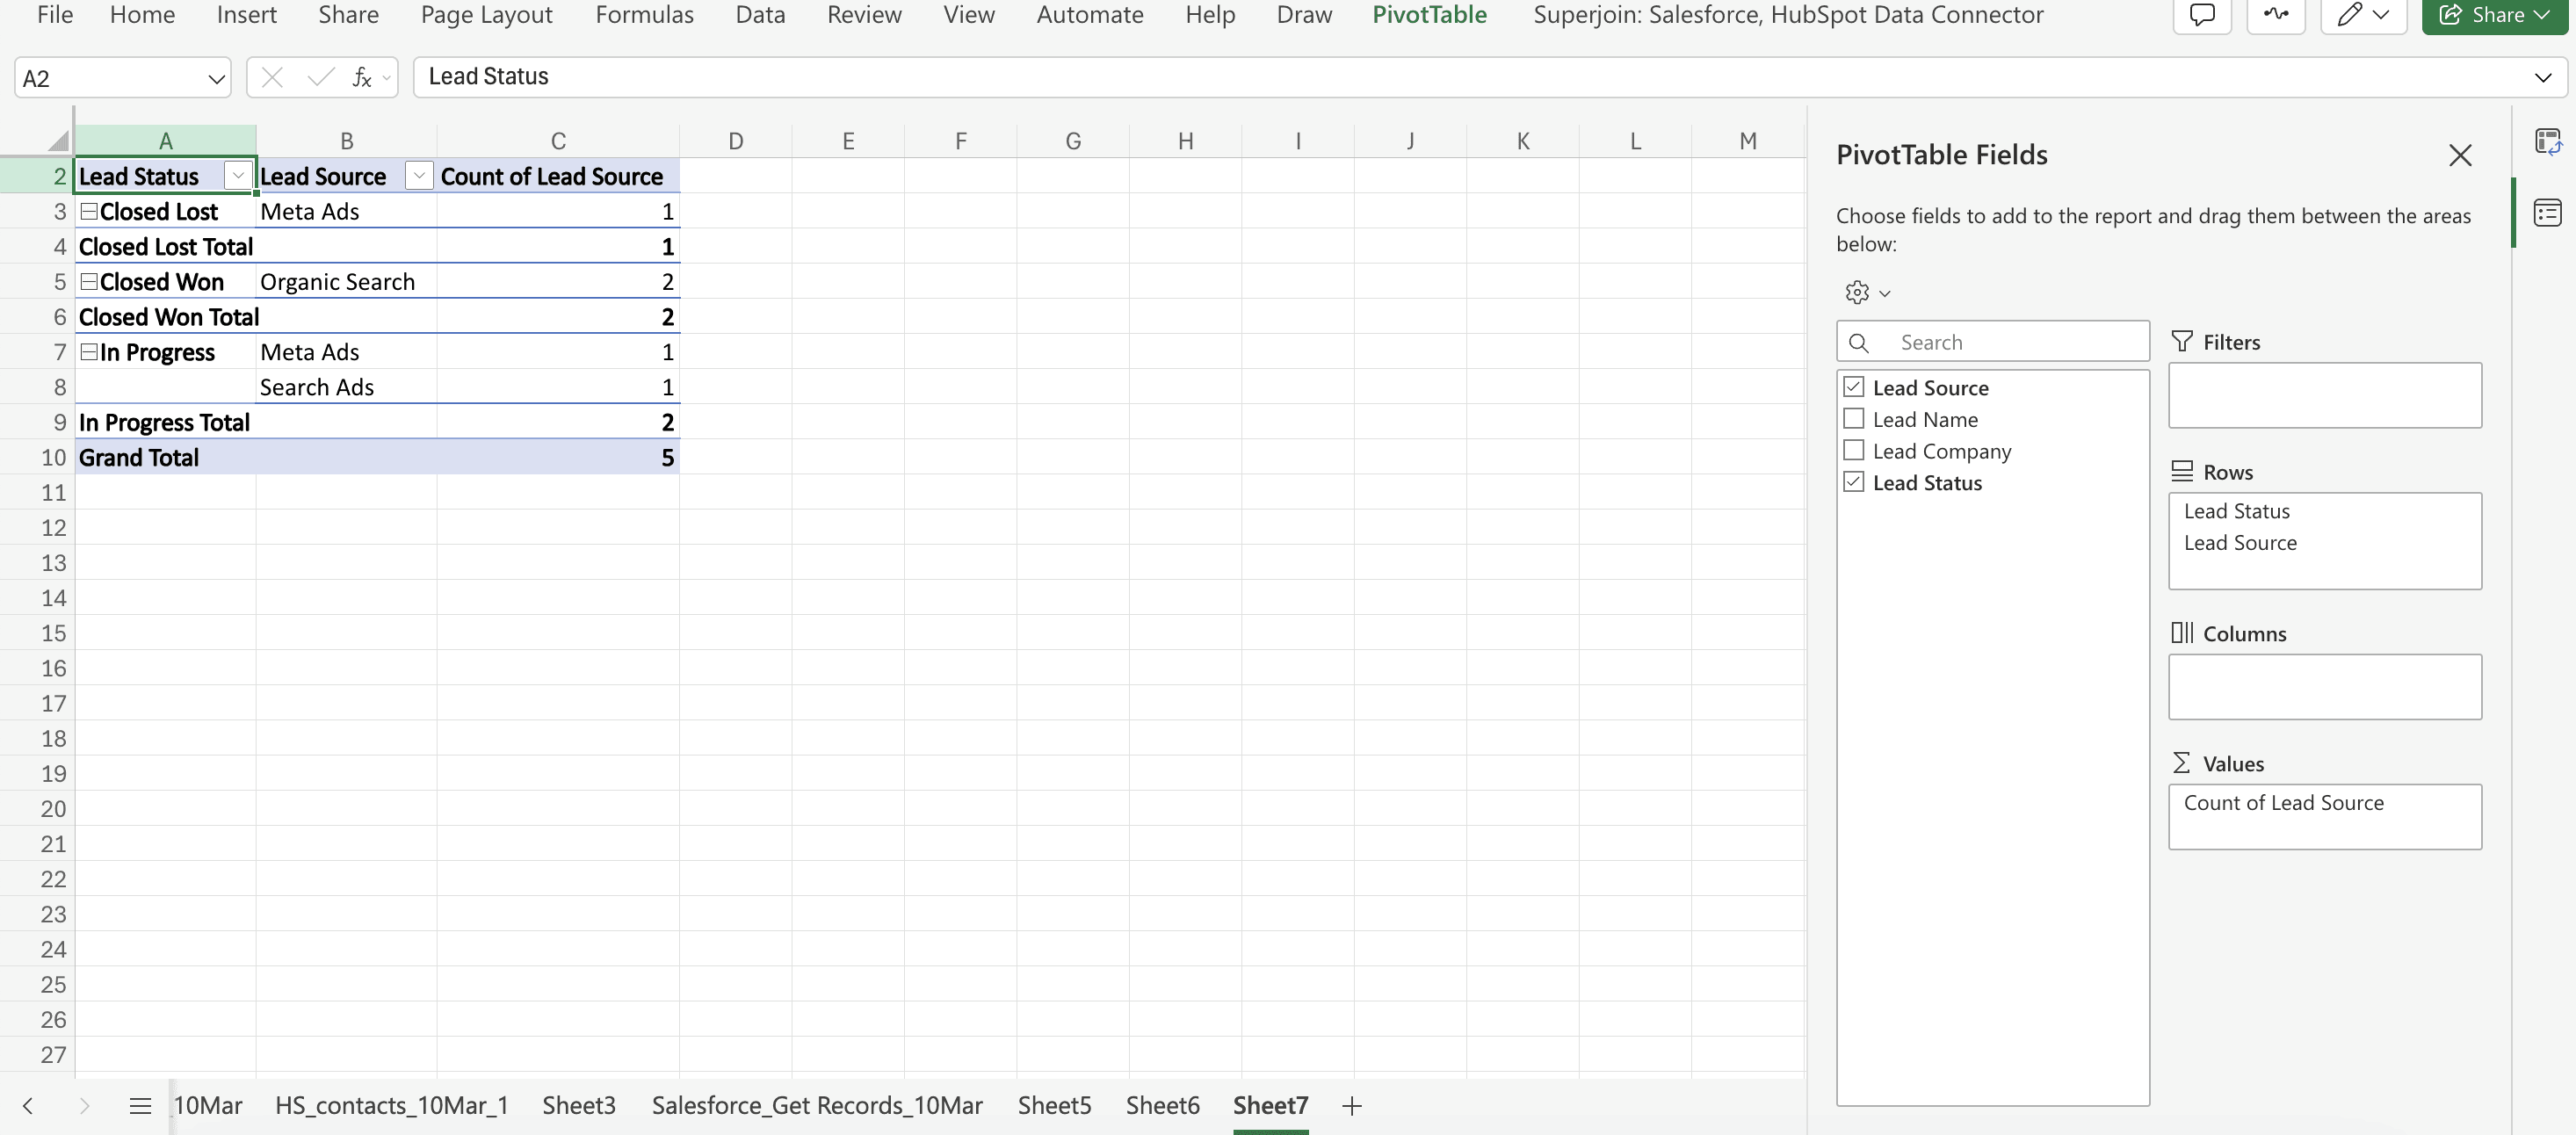
4. Pivot Tables
Pivot tables are a powerful feature in Excel Sheets for summarizing data.
Create a Pivot Table: Go to `Insert > Pivot table.
Select Data Range: Choose the range of your data.
Customise data accordingly - Here in the pivot table we can customise data based on what we want to view.
5. Visualizing Data with Charts
Visual displays can simplify complex data for better comprehension.
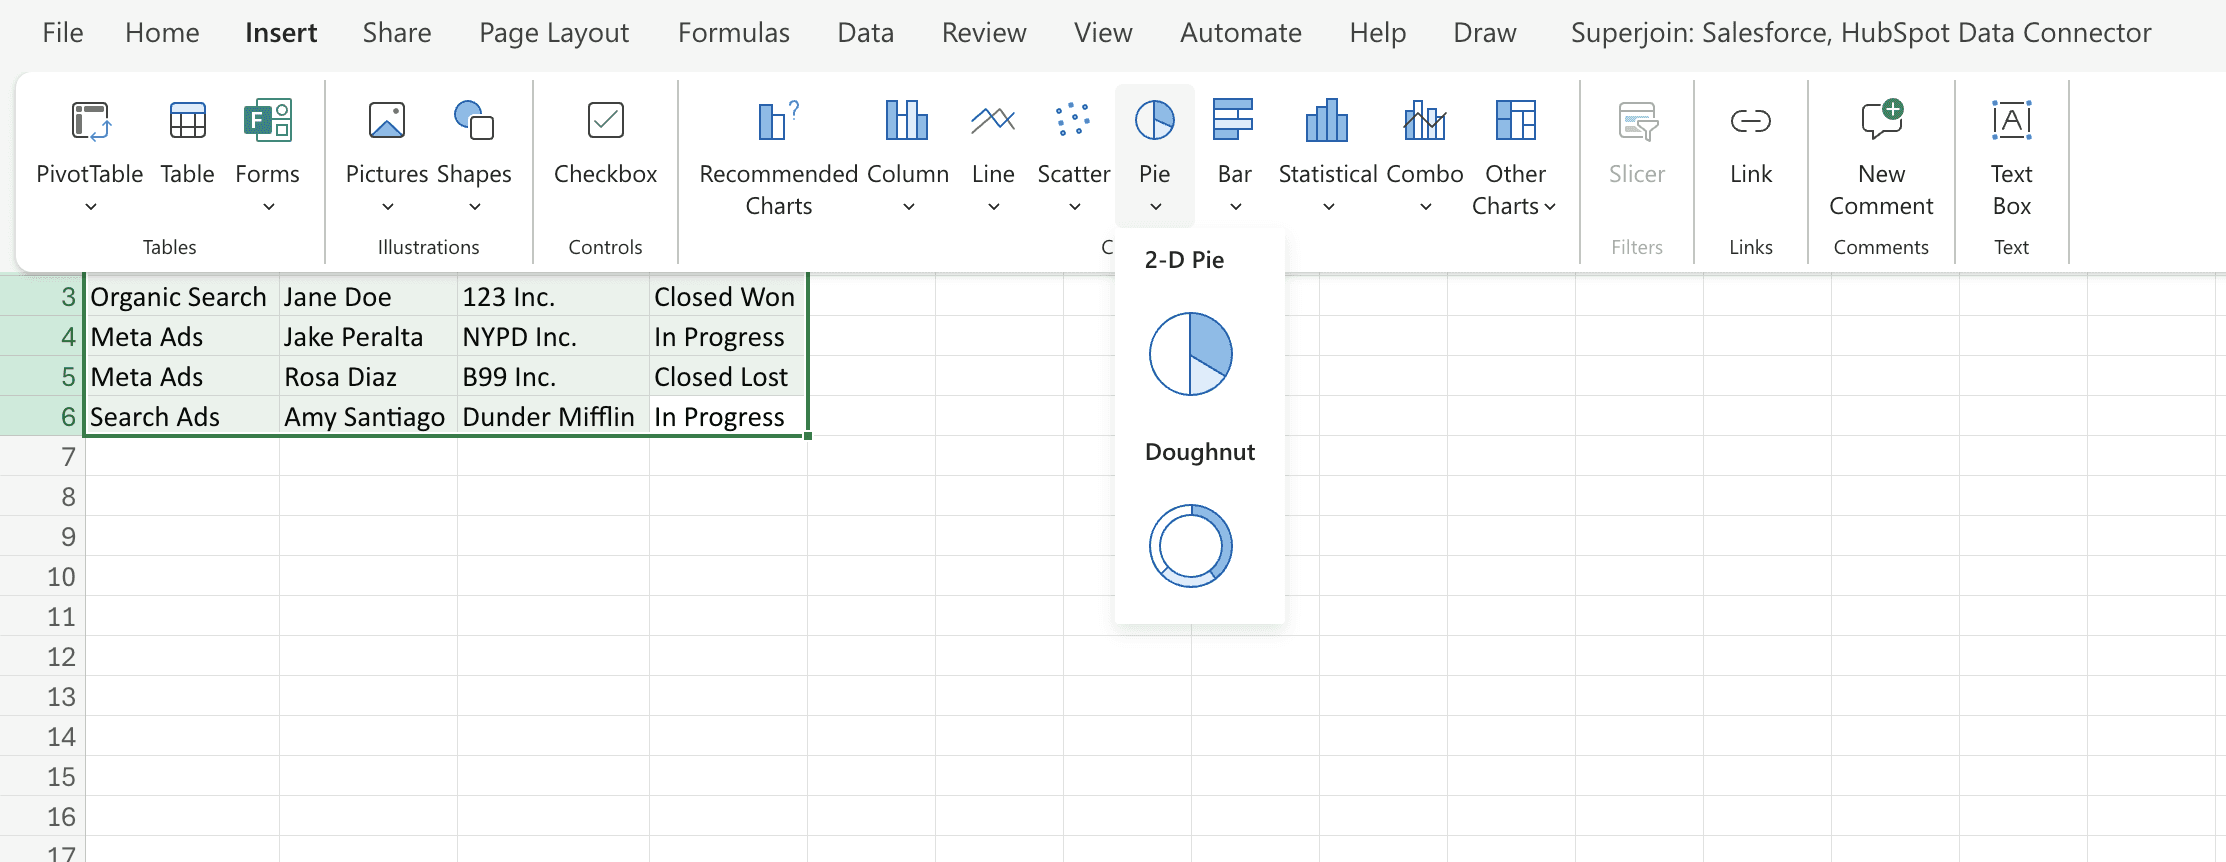
Step 1: Creating a Chart
Select the data you want to visualize, then go to 'Insert > Chart'.
Step 2: Choosing the Right Chart
Step 3: Customizing the Chart. Use the chart editor to customize your chart’s appearance, adding titles, labels, and adjusting colors.
6. Analyze and Interpret
With your data cleaned and organized, analyze the results. Look for trends in lead generation across different channels.
Identify the top channels in terms of lead quantity and quality (consider conversion rates).
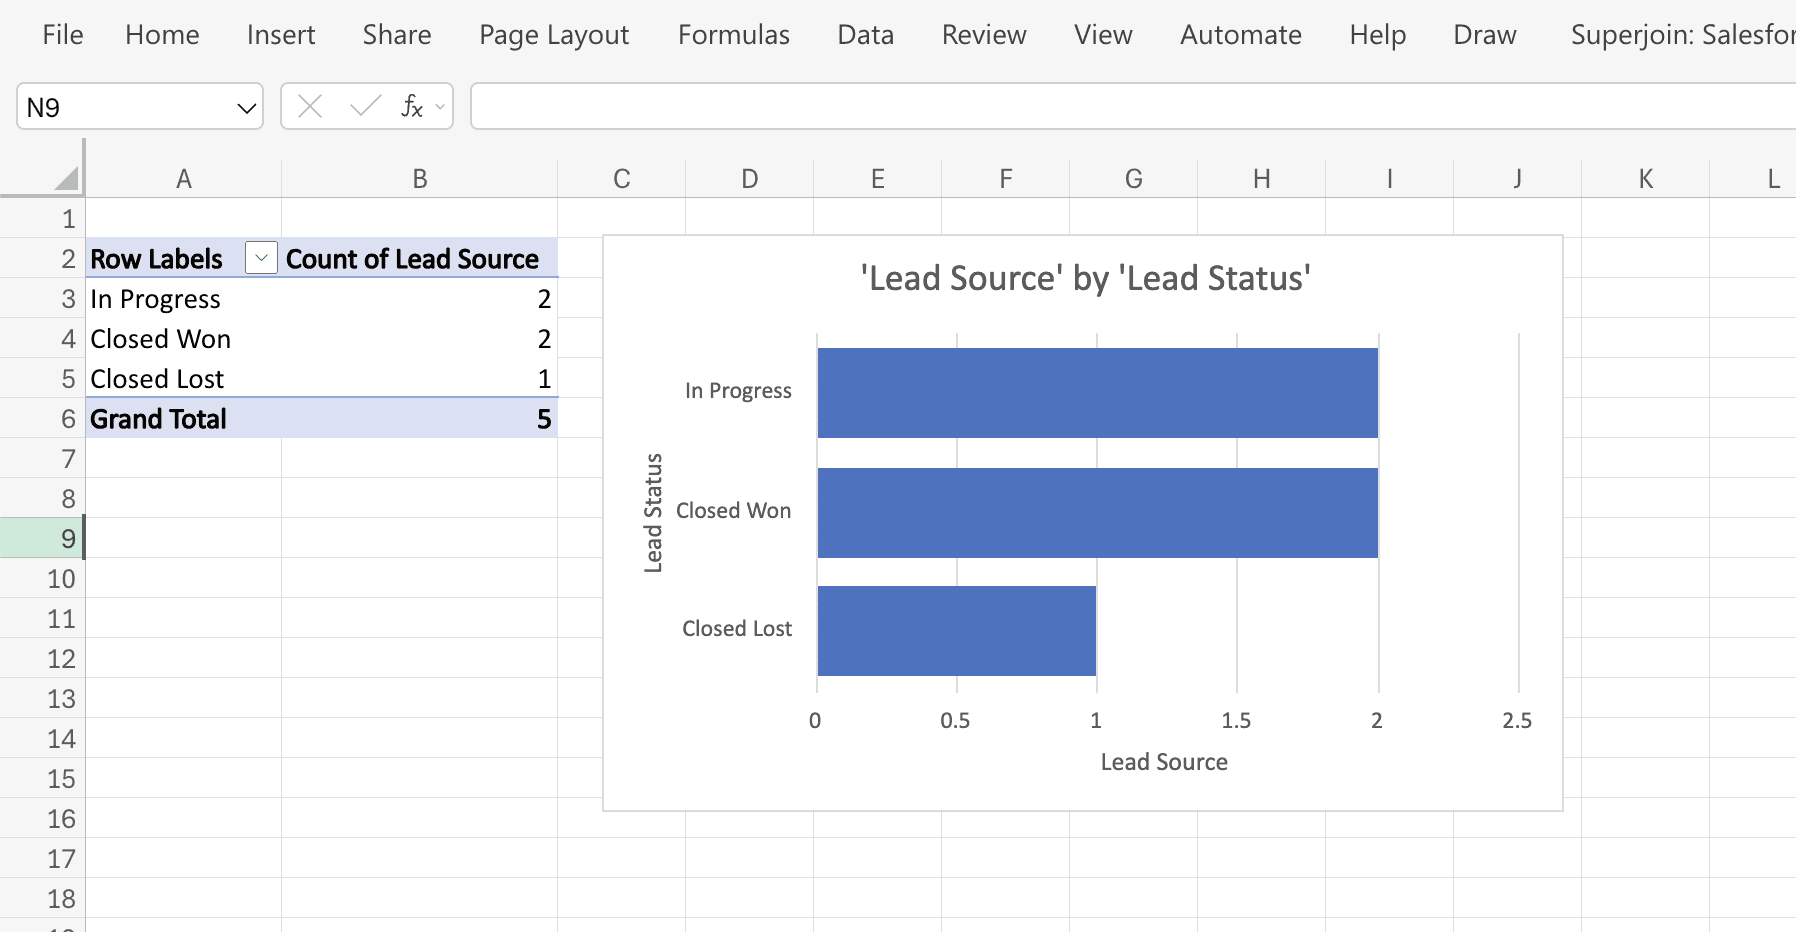
7. Visualize Your Findings
Visual aids such as charts and graphs are effective instruments for illustrating your discoveries. Excel offers a variety of chart options, like bar charts or pie charts, to visually represent your lead source data.
Create clear and concise charts highlighting key takeaways, such as the top lead channels or the distribution of leads across different sources.
8. Actionable Insights
Based on your analysis, formulate actionable insights to optimize your marketing strategy.
Consider allocating more resources to high-performing channels.
Develop strategies to improve the effectiveness of underperforming channels.
Track the impact of these changes over time by repeating the analysis at regular intervals.
Advanced Tips and Techniques
This guide has equipped you with the essential tools and knowledge to perform a comprehensive HubSpot lead source analysis in Excel. Now, let's explore some advanced tips and techniques to elevate your analysis and gain even deeper insights:
Leveraging Third-party Integrations
The Excel ecosystem offers a vast array of add-ons that can further enhance your lead source analysis:
Data Visualisation Tools: To create even more intricate and dynamic charts and visualisations within your dashboard, look at add-ons like "Chartify" or "Plotly".
Data Storytelling Tools: To turn raw data into engaging tales for stakeholders, take into consideration add-ons like "Narrative Science" or "Grow with Excel" that create data-driven narratives and reports.
Data Extraction Tools: To automate the import of data from several connectors, such as HubSpot and Chargebee, use programs like Superjoin.
Integration of Marketing Analytics: Look at add-ons that let you import data from other marketing analytics platforms, such as Facebook Ads or Excel Analytics, in addition to your HubSpot data. This gives you a comprehensive picture of how well your marketing is working across all platforms.
Advanced Segmentation Strategies
Lead Scoring Integration: Take into account including lead score information in your analysis if you use HubSpot's lead scoring feature. This enables you to evaluate lead source performance in terms of lead quality and segment leads according to their score.
Time-based Segmentation: Examine the performance of lead sources across various time periods (weekdays versus weekends, months, quarters, etc.). This might highlight seasonal patterns or pinpoint particular periods of time when particular lead sources are more effective.
Campaign-specific Segmentation: Don't merely analyze high-level sources. Segment leads by certain marketing campaigns inside each source by using UTM parameters or campaign tags in your HubSpot data. This enables you to identify areas for improvement as well as the most successful campaigns inside each channel.
Conclusion
By performing a comprehensive HubSpot lead source analysis in Excel, you gain valuable insights into the effectiveness of your marketing efforts. This empowers you to make data-driven decisions, optimize your campaigns, and ultimately achieve
Say goodbye to tedious data exports! 🚀
Are you tired of spending hours manually exporting CSVs from different tools and importing them into Excel?
Superjoin is a data connector for Excel & Google Sheets that connects your favorite SaaS tools to Excel automatically. You can get data from these platforms into Excel automatically to build reports that update automatically.
Bid farewell to tedious exports and repetitive tasks. With Superjoin, you can add 1 additional day to your week. Try Superjoin out for free or schedule a demo.
FAQs
How can I export HubSpot data to Excel for lead source analysis?
How can I export HubSpot data to Excel for lead source analysis?
How do I categorize lead sources in Excel?
How do I categorize lead sources in Excel?
How do I automate data cleaning for lead analysis in Excel?
How do I automate data cleaning for lead analysis in Excel?
Automatic Data Pulls
Visual Data Preview
Set Alerts
other related blogs
Try it now