RevOps
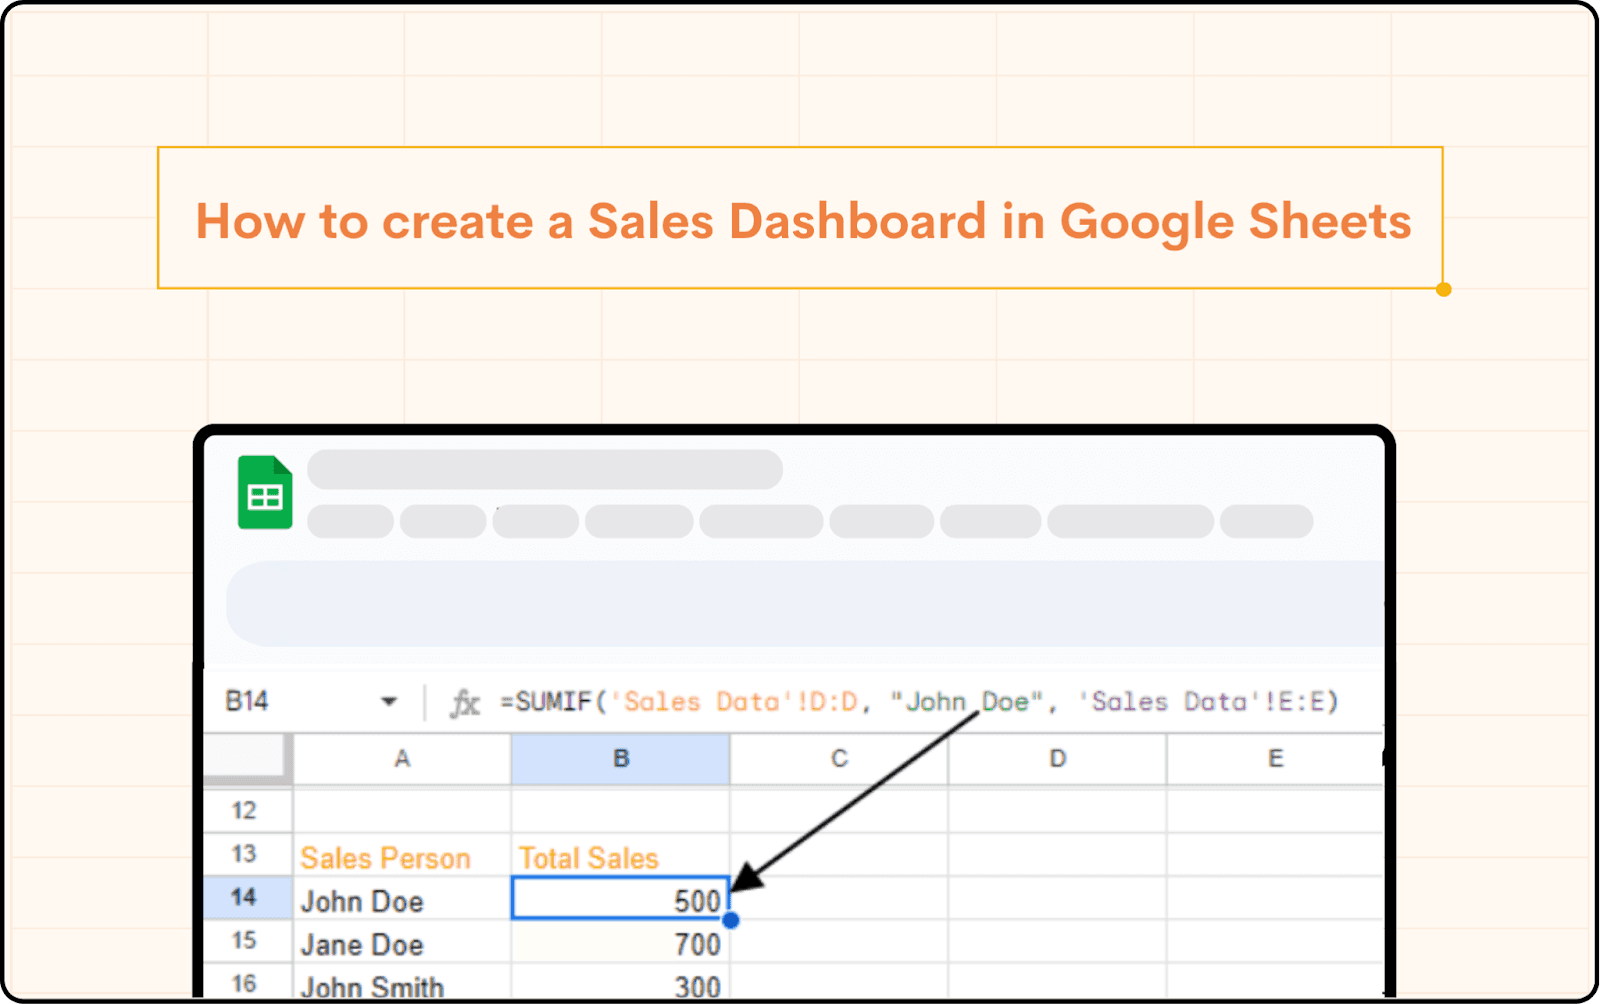
How to Create a Sales Dashboard in Google Sheets (4 Steps)
Create a powerful sales dashboard in Google Sheets! This guide covers sales dashboards, using Superjoin for data import and crafting interactive visualizations.
Table of Contents
In the fast-paced world of sales, staying on top of key metrics is crucial for success. A well-designed sales dashboard can be your secret weapon, providing a clear and concise overview of your sales performance at a glance. This guide dives deep into creating a dynamic sales dashboard in Google Sheets, a readily available and free tool that empowers you to visualize your sales data effectively.
What is a Google Sheets Sales Dashboard?
A Google Sheets Sales Dashboard is a visual representation of your sales performance, consolidating key metrics and trends into a single, easy-to-understand interface on Google Sheets. It acts as a central hub, empowering you to track progress toward goals, identify areas for improvement, and make data-driven decisions to optimize your sales strategy.
Creating a sales dashboard in Google Sheets involves organizing and displaying key data, but what if you’re managing large datasets from different sources? Integrating MySQL to Google Sheets allows you to pull real-time sales data directly from your MySQL database into your dashboard, ensuring your metrics are always up-to-date without manual entry. This connection enhances your Google Sheets experience by automating the data sync process, especially for businesses relying on MySQL for sales records and customer information.
A Step-by-Step Guide to Create a Google Sheets Sales Dashboard
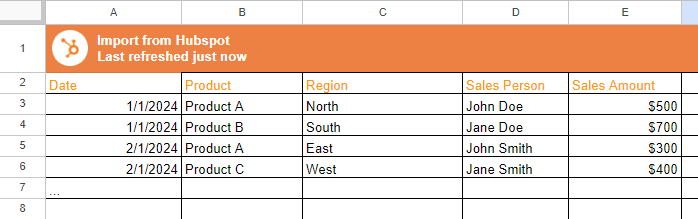
Step 1: Importing Data Using Superjoin
While you can manually enter data into Google Sheets, consider using Superjoin for a more streamlined approach, especially if you're working with data from external sources like CRM systems. Superjoin is a free add-on for Google Sheets that simplifies data import from various platforms.
For detailed instructions on connecting HubSpot to Google Sheets, please refer to our blog, “How to Integrate HubSpot to Google Sheets Seamlessly”. Alternatively, if you prefer using Excel you can install Superjoin on Microsoft Excel as well.
Step 2: Organize Data with Formulas
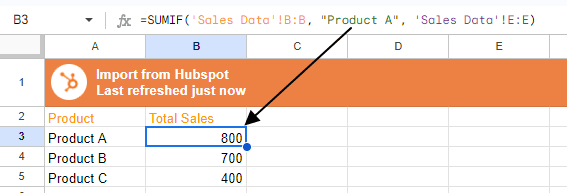
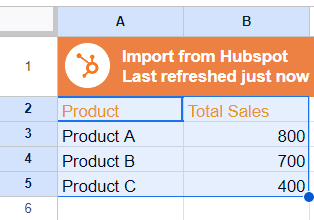
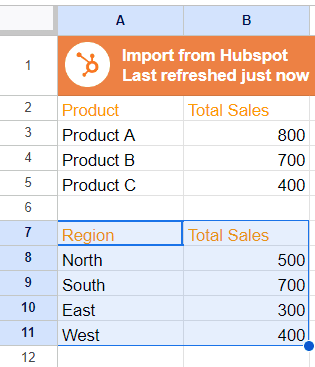
Create Summary Tables:
Create another sheet titled "Summary".
Use formulas to summarize the data. For instance, to calculate total sales by product:
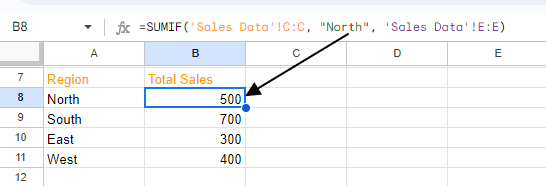
2. Calculate Total Sales by Region:
To calculate total sales by region, use:
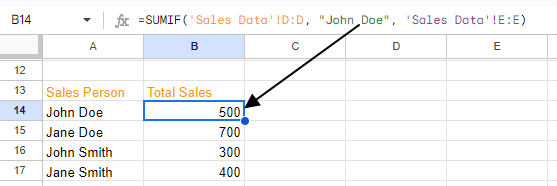
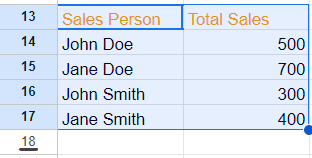
3. Salesperson Performance:
For total sales by salesperson:
Step 3: Create Visualizations
Create Charts:
Go back to your "Sales Data" or "Summary" sheet.
Select the data you want to visualize.
Go to Insert > Chart.
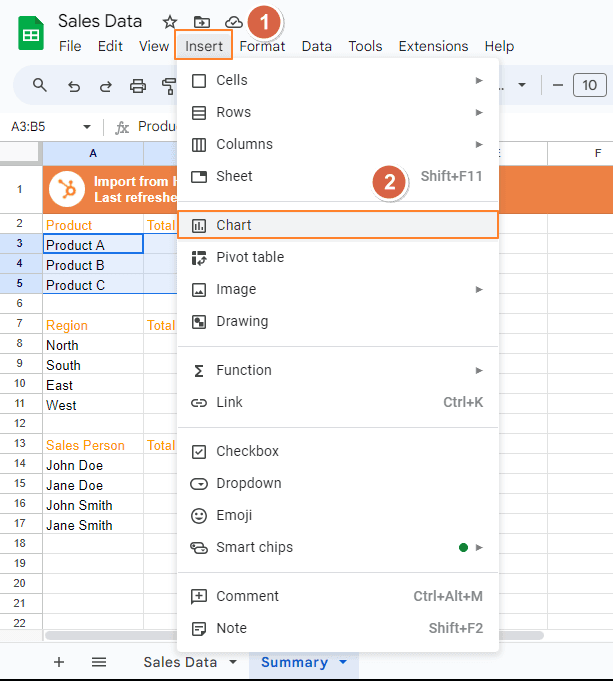
In the Chart Editor, choose the type of chart that best represents your data (e.g., bar chart, pie chart, line chart).
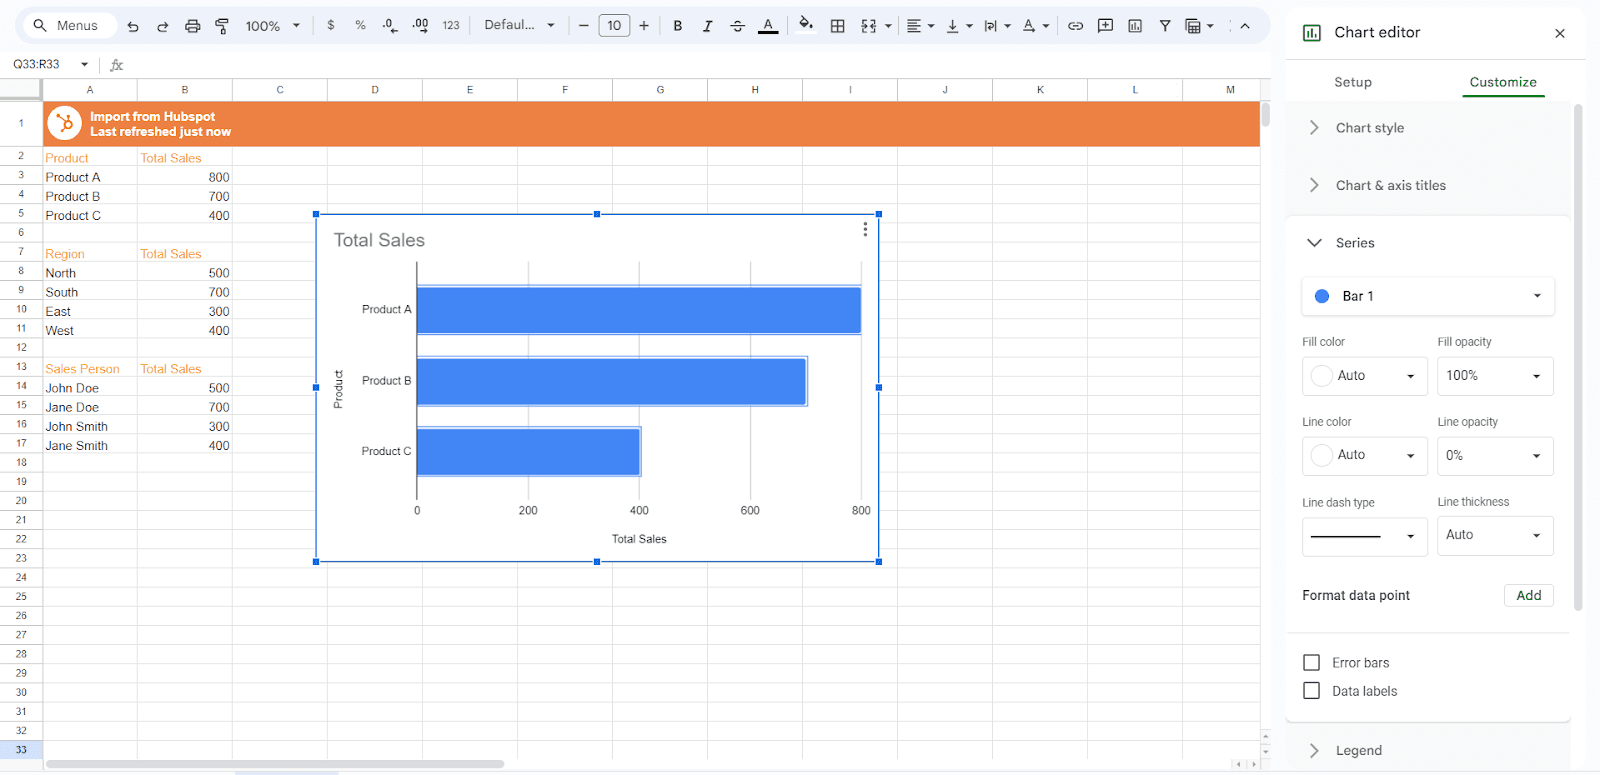
Configure Charts:
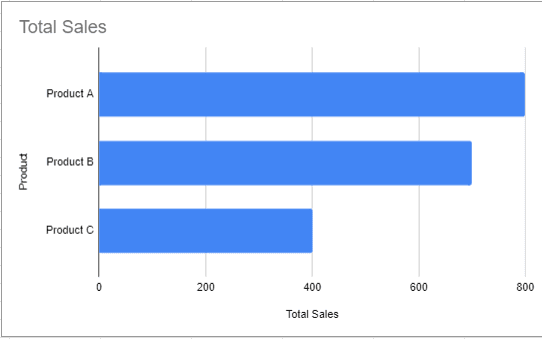
For a Total Sales by Product bar chart:
Select the range A2:B5 from the Summary sheet.
Insert a bar chart and customize it with titles, colors, and labels.
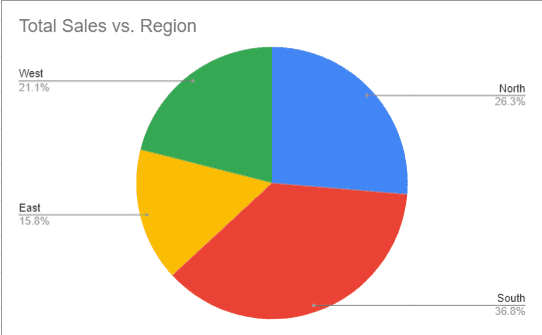
For a Sales by Region pie chart:
Select the range A7:B11 from the Summary sheet.
Insert a pie chart and customize it accordingly.
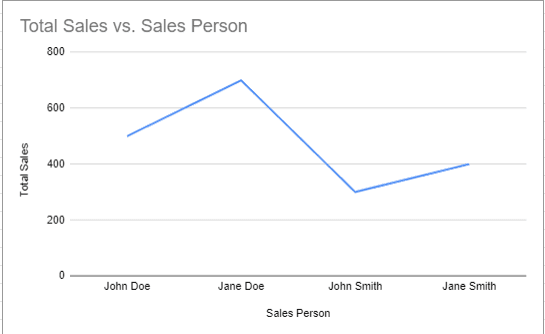
For a Sales by SalesPerson line chart:
Select the range A13:B17 from the Summary sheet.
Insert a line chart and customize it accordingly.
Step 4: Customize and Share
Customize Dashboard:
Add titles, labels, and color-coding to make the dashboard easy to understand.
Share the Dashboard:
Go to File > Share > Share with others.
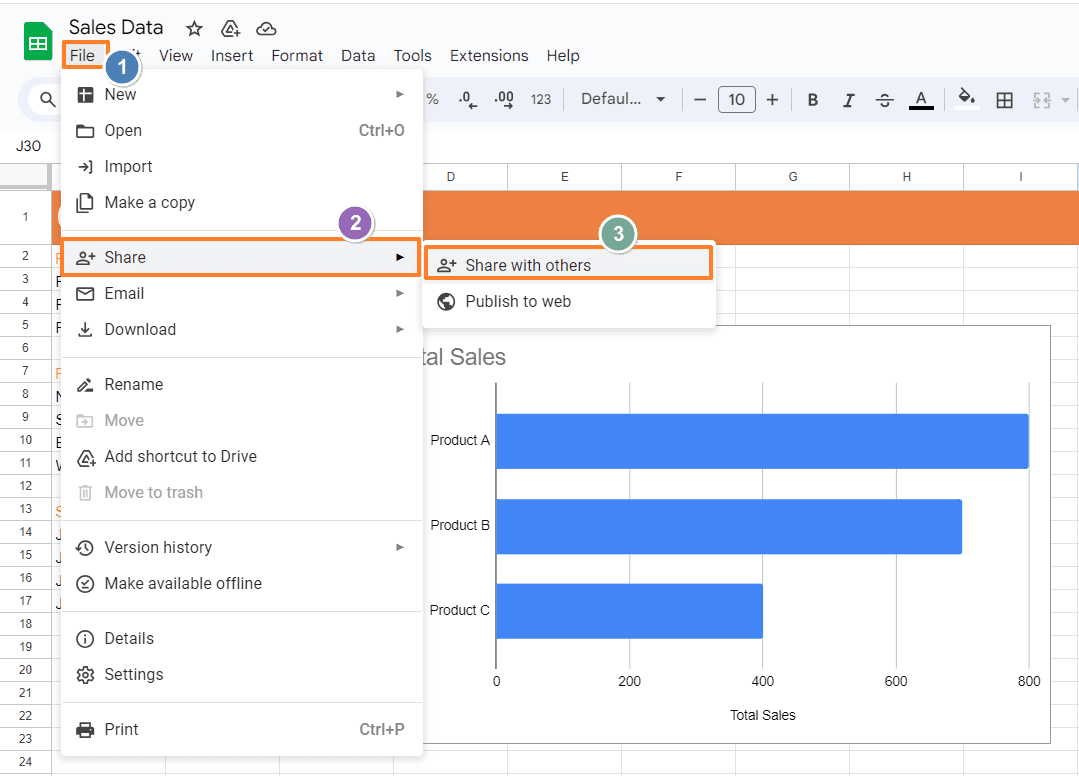
Enter the email addresses of people you want to share the dashboard with and set their access permissions (e.g., view-only, edit).
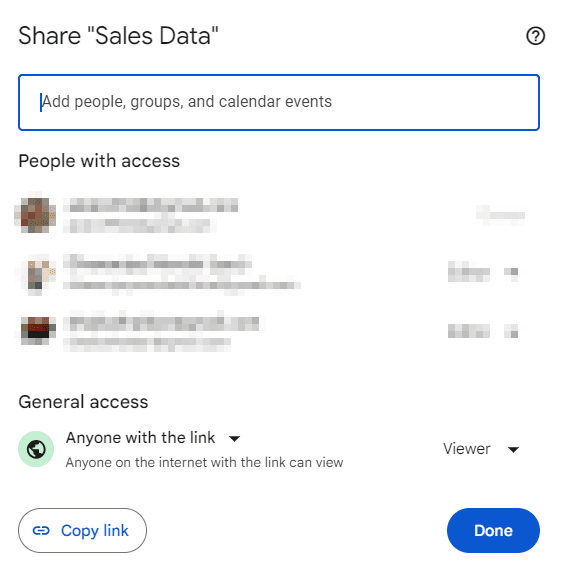
Click “Done”.
To simplify creating your sales dashboard, Start with a Free Template we've created. You can simply customize the sections and plug in your data!
Conclusion
In today's data-driven sales landscape, having a clear and concise overview of your performance is crucial. A well-crafted Google Sheets sales dashboard in Google Sheets equips you with the power to visualize trends, identify areas for improvement, and make informed decisions to optimize your sales strategy.
By following the steps outlined in this guide, you can leverage the accessibility and user-friendliness of Google Sheets to create a powerful Google Sheets sales dashboard. Remember to prioritize the most relevant KPIs for your specific goals, present information visually and intuitively, and maintain consistent data updates.
While Google Sheets offers a compelling solution for many businesses, acknowledging potential challenges like data quality and collaboration limitations allows you to choose the right approach for your needs.
So, unleash the potential of Google Sheets and empower your sales team with a dynamic and informative dashboard. Watch your sales performance soar as you gain valuable insights and make data-driven decisions that drive success.
Say Goodbye To Tedious Data Exports!
Are you tired of spending hours manually exporting CSVs from different tools and importing them into Google Sheets?
Superjoin is a data connector for Google Sheets that connects your favorite SaaS tools to Google Sheets automatically. You can get data from these platforms into Google Sheets automatically to build reports that update automatically.
Try Superjoin out for free or schedule a demo.
In the fast-paced world of sales, staying on top of key metrics is crucial for success. A well-designed sales dashboard can be your secret weapon, providing a clear and concise overview of your sales performance at a glance. This guide dives deep into creating a dynamic sales dashboard in Google Sheets, a readily available and free tool that empowers you to visualize your sales data effectively.
What is a Google Sheets Sales Dashboard?
A Google Sheets Sales Dashboard is a visual representation of your sales performance, consolidating key metrics and trends into a single, easy-to-understand interface on Google Sheets. It acts as a central hub, empowering you to track progress toward goals, identify areas for improvement, and make data-driven decisions to optimize your sales strategy.
Creating a sales dashboard in Google Sheets involves organizing and displaying key data, but what if you’re managing large datasets from different sources? Integrating MySQL to Google Sheets allows you to pull real-time sales data directly from your MySQL database into your dashboard, ensuring your metrics are always up-to-date without manual entry. This connection enhances your Google Sheets experience by automating the data sync process, especially for businesses relying on MySQL for sales records and customer information.
A Step-by-Step Guide to Create a Google Sheets Sales Dashboard
Step 1: Importing Data Using Superjoin
While you can manually enter data into Google Sheets, consider using Superjoin for a more streamlined approach, especially if you're working with data from external sources like CRM systems. Superjoin is a free add-on for Google Sheets that simplifies data import from various platforms.
For detailed instructions on connecting HubSpot to Google Sheets, please refer to our blog, “How to Integrate HubSpot to Google Sheets Seamlessly”. Alternatively, if you prefer using Excel you can install Superjoin on Microsoft Excel as well.
Step 2: Organize Data with Formulas
Create Summary Tables:
Create another sheet titled "Summary".
Use formulas to summarize the data. For instance, to calculate total sales by product:
2. Calculate Total Sales by Region:
To calculate total sales by region, use:
3. Salesperson Performance:
For total sales by salesperson:
Step 3: Create Visualizations
Create Charts:
Go back to your "Sales Data" or "Summary" sheet.
Select the data you want to visualize.
Go to Insert > Chart.
In the Chart Editor, choose the type of chart that best represents your data (e.g., bar chart, pie chart, line chart).
Configure Charts:
For a Total Sales by Product bar chart:
Select the range A2:B5 from the Summary sheet.
Insert a bar chart and customize it with titles, colors, and labels.
For a Sales by Region pie chart:
Select the range A7:B11 from the Summary sheet.
Insert a pie chart and customize it accordingly.
For a Sales by SalesPerson line chart:
Select the range A13:B17 from the Summary sheet.
Insert a line chart and customize it accordingly.
Step 4: Customize and Share
Customize Dashboard:
Add titles, labels, and color-coding to make the dashboard easy to understand.
Share the Dashboard:
Go to File > Share > Share with others.
Enter the email addresses of people you want to share the dashboard with and set their access permissions (e.g., view-only, edit).
Click “Done”.
To simplify creating your sales dashboard, Start with a Free Template we've created. You can simply customize the sections and plug in your data!
Conclusion
In today's data-driven sales landscape, having a clear and concise overview of your performance is crucial. A well-crafted Google Sheets sales dashboard in Google Sheets equips you with the power to visualize trends, identify areas for improvement, and make informed decisions to optimize your sales strategy.
By following the steps outlined in this guide, you can leverage the accessibility and user-friendliness of Google Sheets to create a powerful Google Sheets sales dashboard. Remember to prioritize the most relevant KPIs for your specific goals, present information visually and intuitively, and maintain consistent data updates.
While Google Sheets offers a compelling solution for many businesses, acknowledging potential challenges like data quality and collaboration limitations allows you to choose the right approach for your needs.
So, unleash the potential of Google Sheets and empower your sales team with a dynamic and informative dashboard. Watch your sales performance soar as you gain valuable insights and make data-driven decisions that drive success.
Say Goodbye To Tedious Data Exports!
Are you tired of spending hours manually exporting CSVs from different tools and importing them into Google Sheets?
Superjoin is a data connector for Google Sheets that connects your favorite SaaS tools to Google Sheets automatically. You can get data from these platforms into Google Sheets automatically to build reports that update automatically.
Try Superjoin out for free or schedule a demo.
FAQs
Is Google Sheets powerful enough for complex sales dashboards?
Is Google Sheets powerful enough for complex sales dashboards?
What data sources can I connect to Google Sheets for my dashboard?
What data sources can I connect to Google Sheets for my dashboard?
Can multiple people collaborate on the sales dashboard in Google Sheets?
Can multiple people collaborate on the sales dashboard in Google Sheets?
Automatic Data Pulls
Visual Data Preview
Set Alerts
other related blogs
Try it now