HubSpot Tutorial
How to Embed Google Sheets Charts into a HubSpot Dashboard
Discover how to embed Google Sheets charts into HubSpot dashboards effortlessly. Enhance your data visualization for better insights.


HubSpot dashboards are a powerful tool for visualizing your sales and marketing data in a single, digestible view. But what if you could leverage the robust charting capabilities of Google Sheets within your HubSpot environment? Well, you can! This blog will guide you through the process of embedding Google Sheets charts into your HubSpot dashboards, unlocking a new level of data visualization and analysis.
Why Embed Google Sheets Charts into a HubSpot Dashboard?
HubSpot dashboards are a cornerstone for many organizations, providing a centralized location to visualize key sales and marketing metrics. However, the built-in chart options, while functional, can feel restrictive. Here's where Google Sheets steps in:
Chart Variety: Google Sheets offers a much wider range of chart types than HubSpot's native selection. Explore scatter plots to uncover relationships between variables, waterfall charts to understand the cumulative impact of factors, stock charts to track trends over time, and many more!
Customization Granularity: Unleash your inner data artist! Google Sheets allows for in-depth customization of chart elements like axes, data labels, and overall look and feel. Tailor your charts to align perfectly with your brand identity and ensure clarity for viewers.
Live Updates: Gone are the days of manually recreating charts for your HubSpot dashboard. By embedding a live Google Sheet chart into Hubspot, any updates to the underlying Google Sheets are automatically reflected within the dashboard. This ensures your visualizations are always fresh and based on the latest information.
These benefits combined significantly enhance the effectiveness of your HubSpot dashboards. Imagine a sales dashboard showcasing a dynamic scatter plot revealing the correlation between marketing spend and lead generation, or a marketing ROI dashboard featuring a captivating stock chart visually depicting campaign performance over time. The possibilities are truly endless.
Steps to Embed Google Sheets Charts into HubSpot Dashboards
Now, let's get down to business! Here's a step-by-step guide:
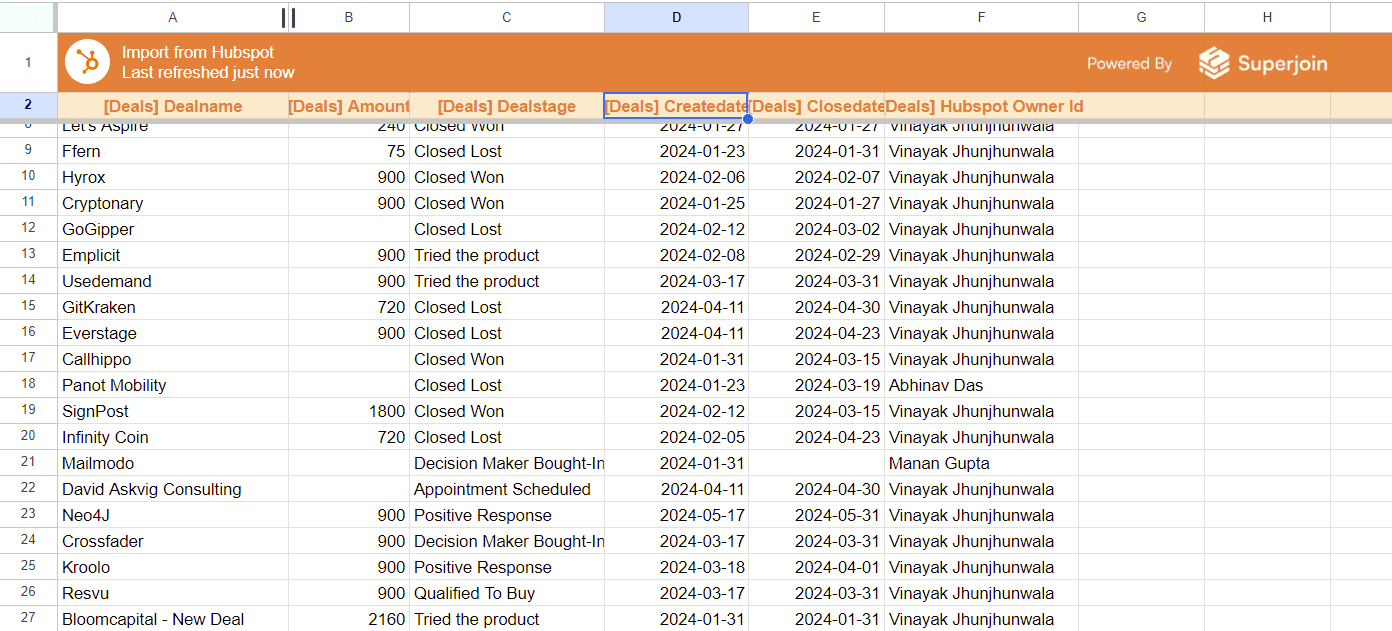
First of all, let's utilize a sample dataset to demonstrate how to embed Google Sheets charts in HubSpot dashboards. For detailed instructions on connecting HubSpot to Google Sheets, please refer to our blog “How to Integrate HubSpot to Google Sheets Seamlessly”.
A. Create Your Google Sheet Chart:
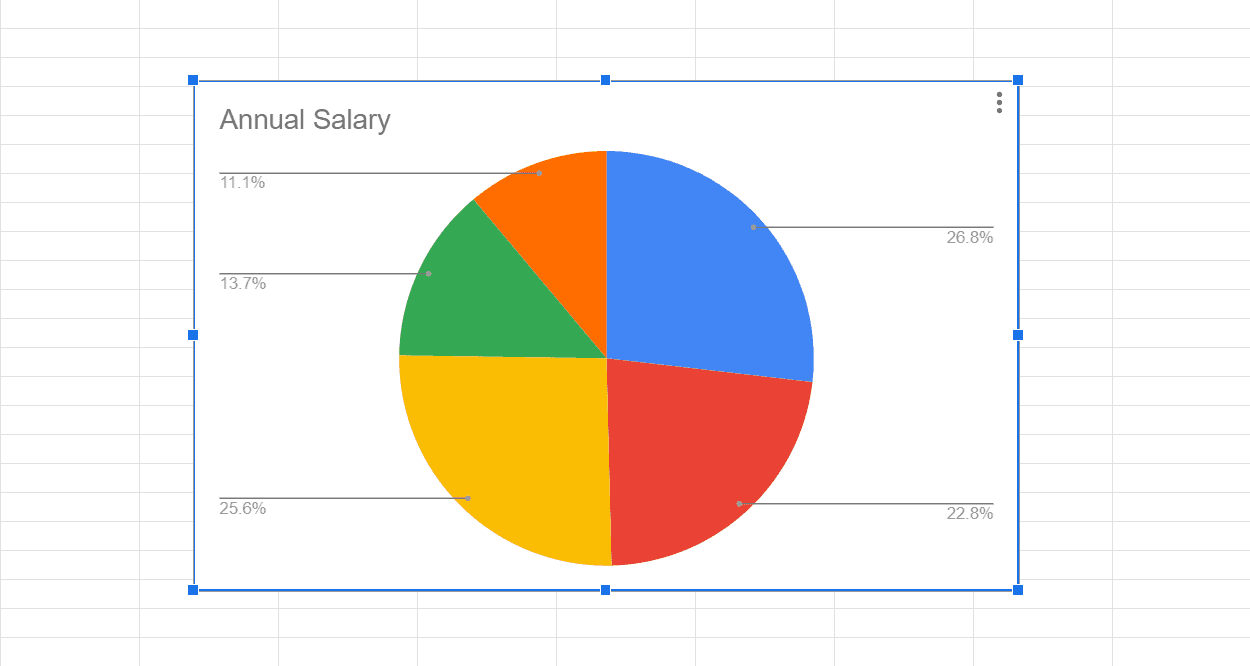
In your Google Sheet build your desired chart using the available options.
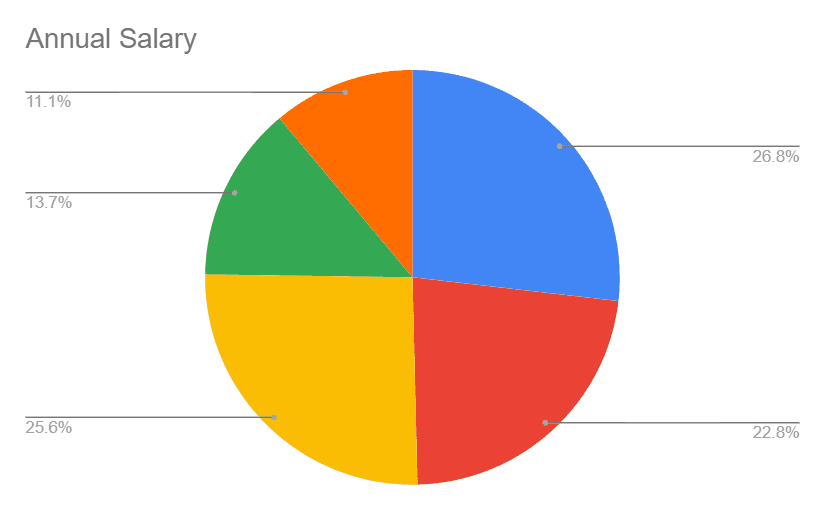
Customize the chart's appearance to your liking using the formatting tools.
B. Publish the Chart for Embedding:
Select the ellipsis symbol (...) located at the upper-right corner of your chart.
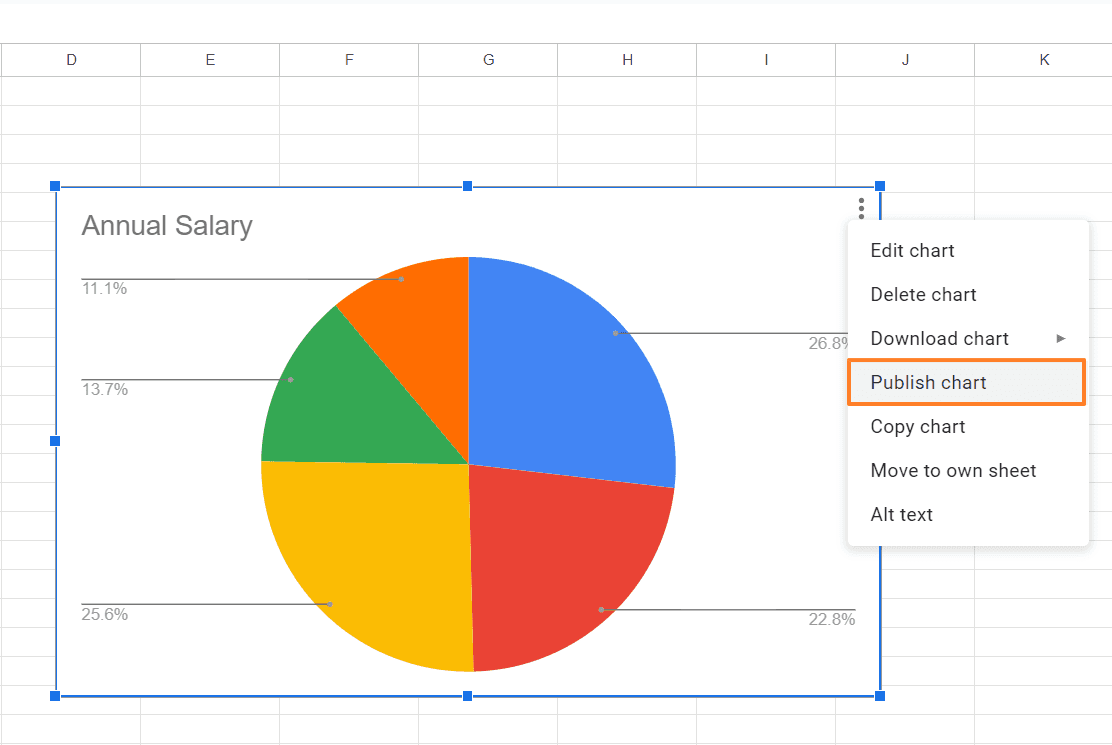
Select "Publish chart."
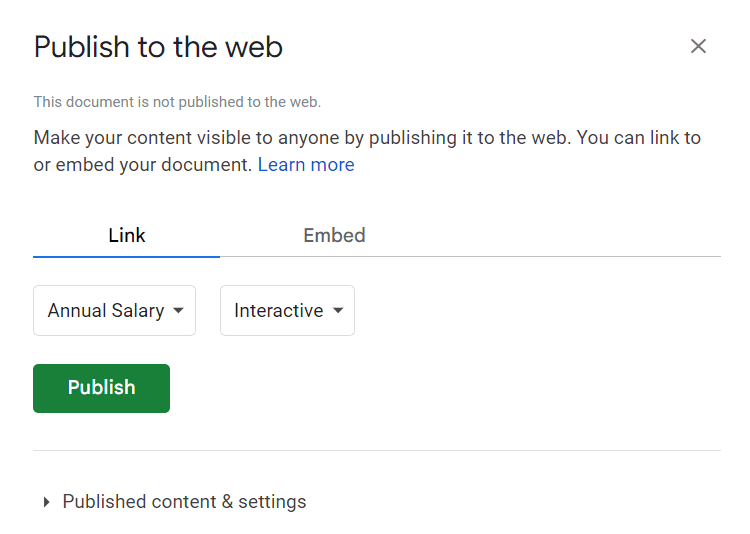
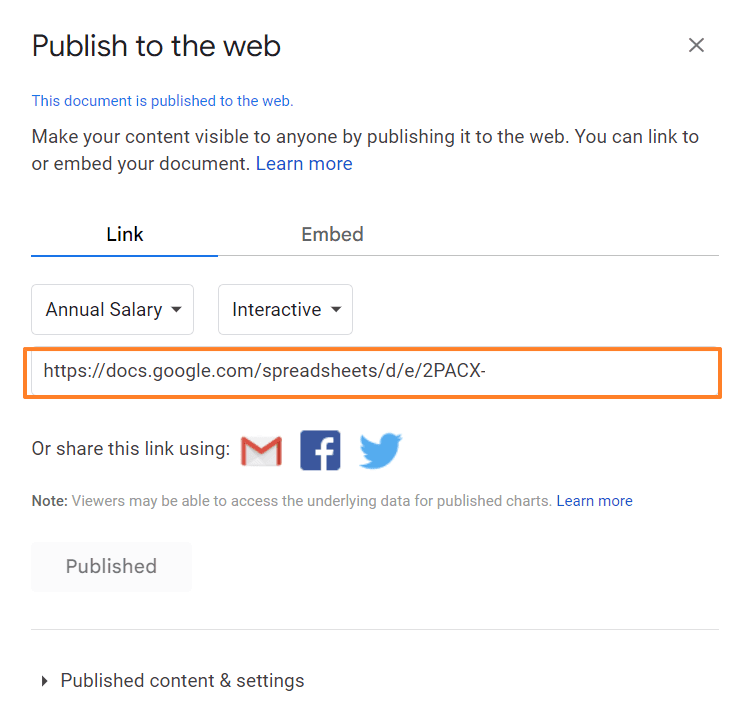
Under the "Link" tab, ensure "Interactive" is selected. This allows for user interaction with the chart within HubSpot.
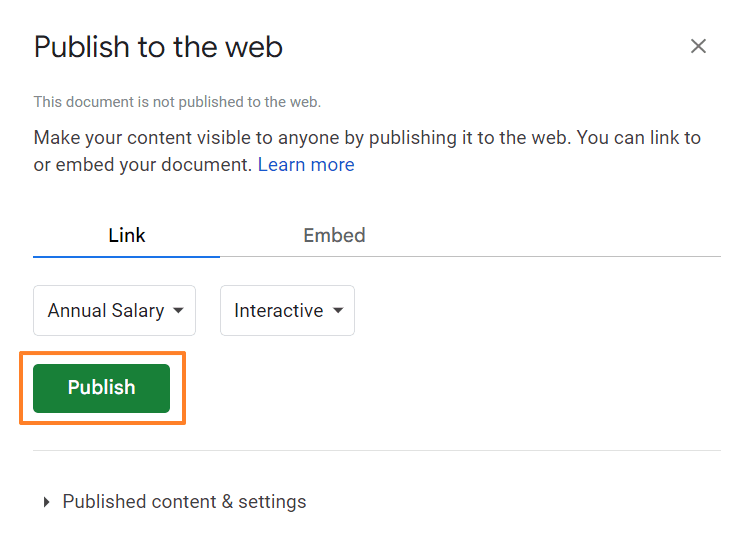
Click "Publish" and then "OK" in the confirmation dialog.
Copy the Embed Link: In the publish dialogue box, you'll see a link labeled "Embed." This is the link you'll use to embed the chart in HubSpot.
C. Add External Content to Your HubSpot Dashboard:
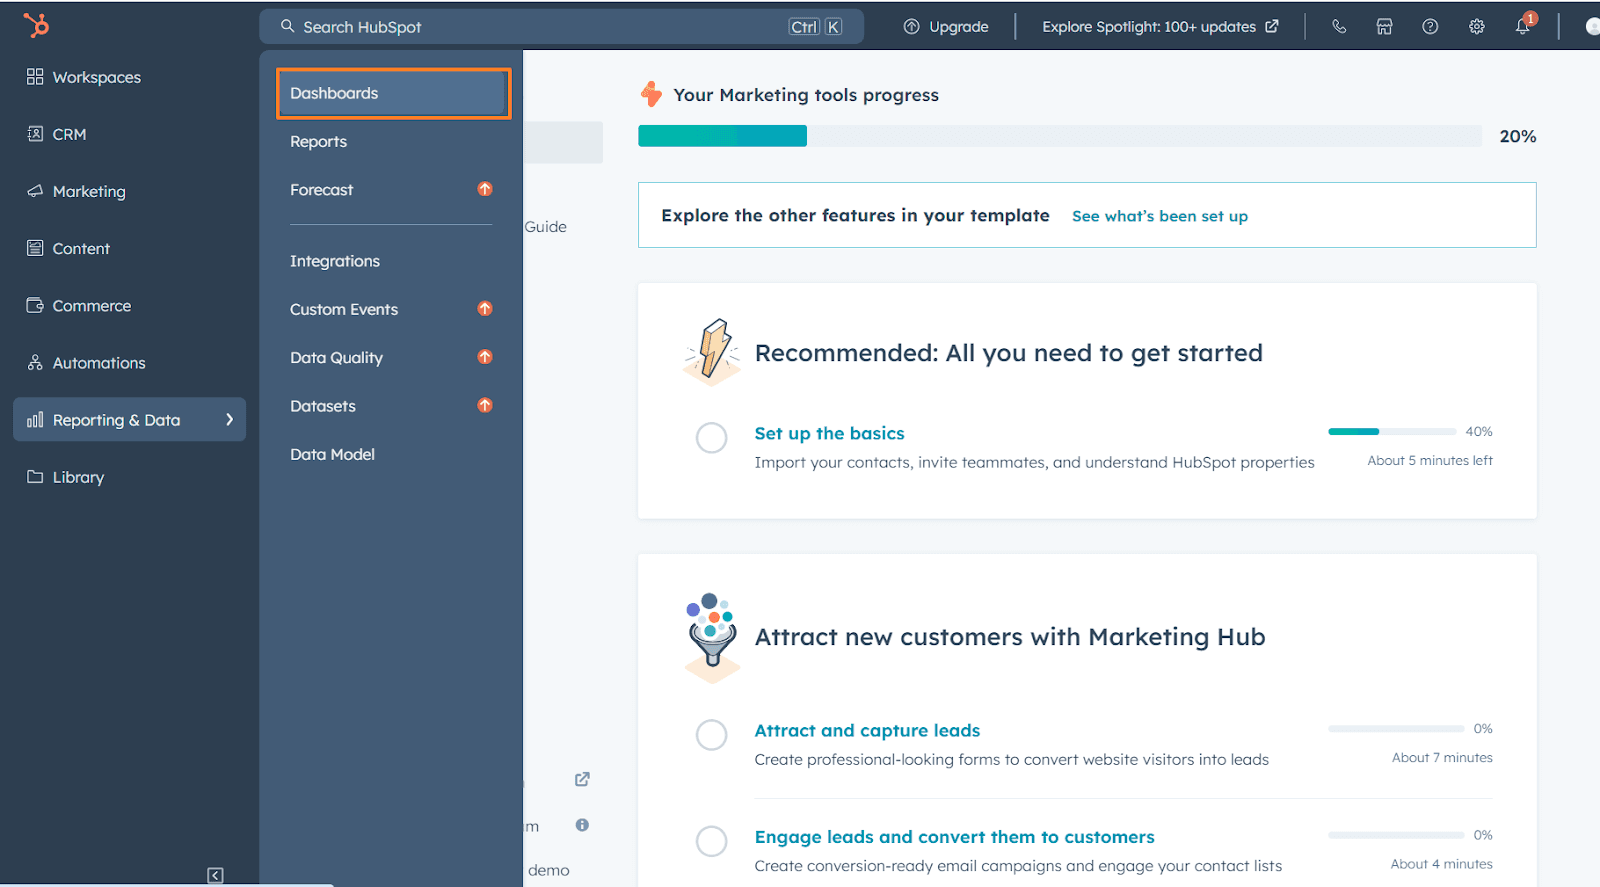
Log in to your HubSpot account and navigate to Reporting & Data > Dashboards.
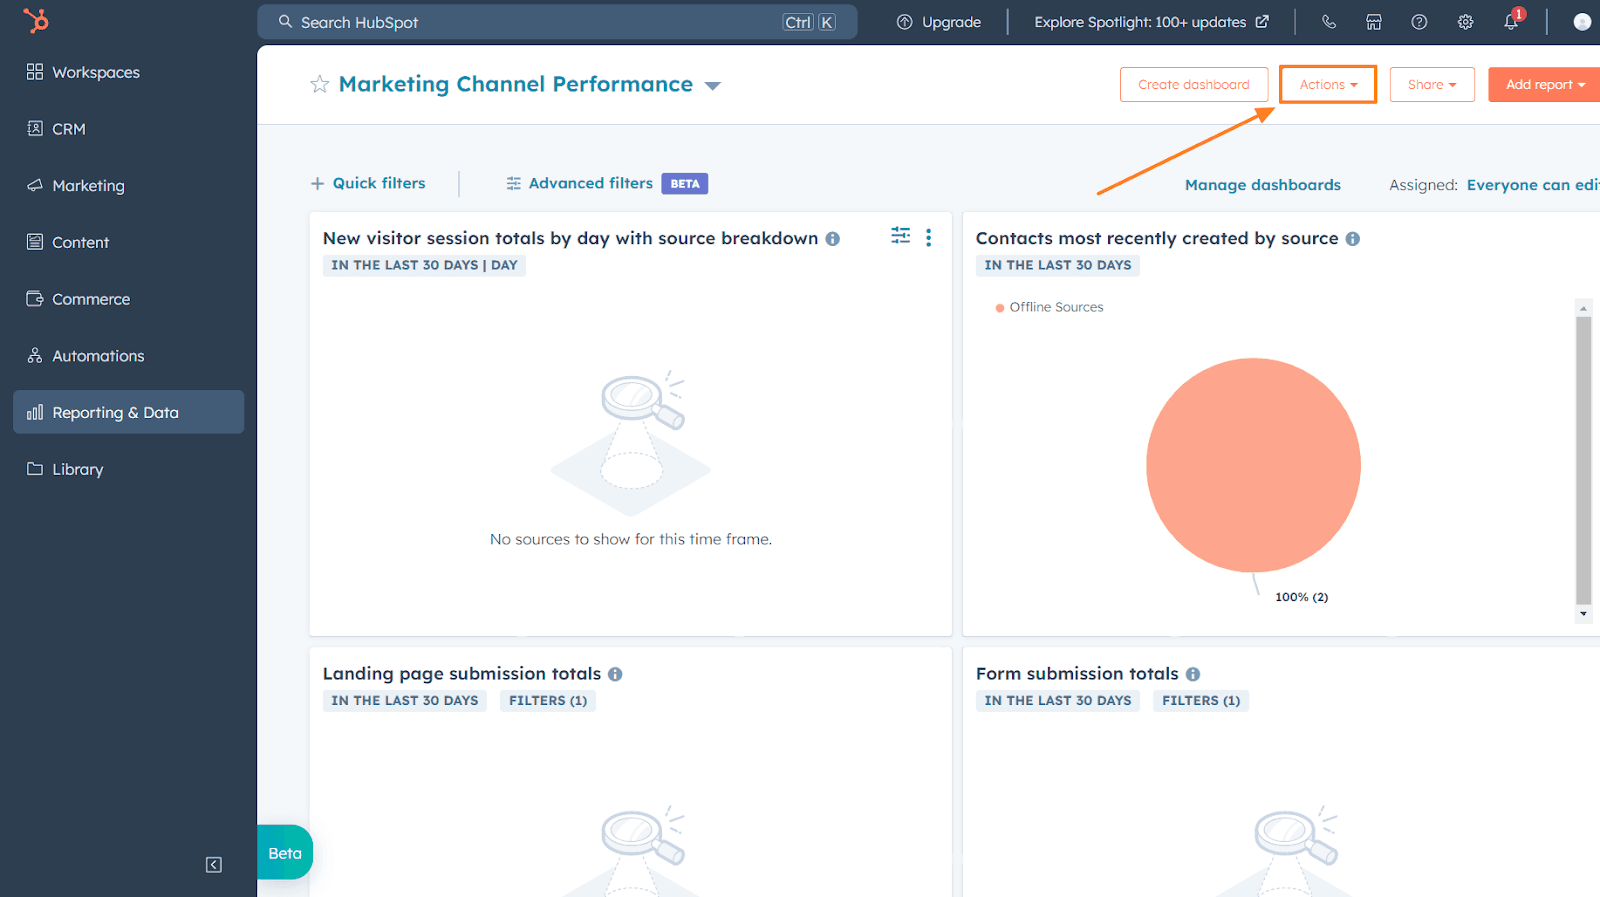
Select the dashboard where you want to embed the chart.
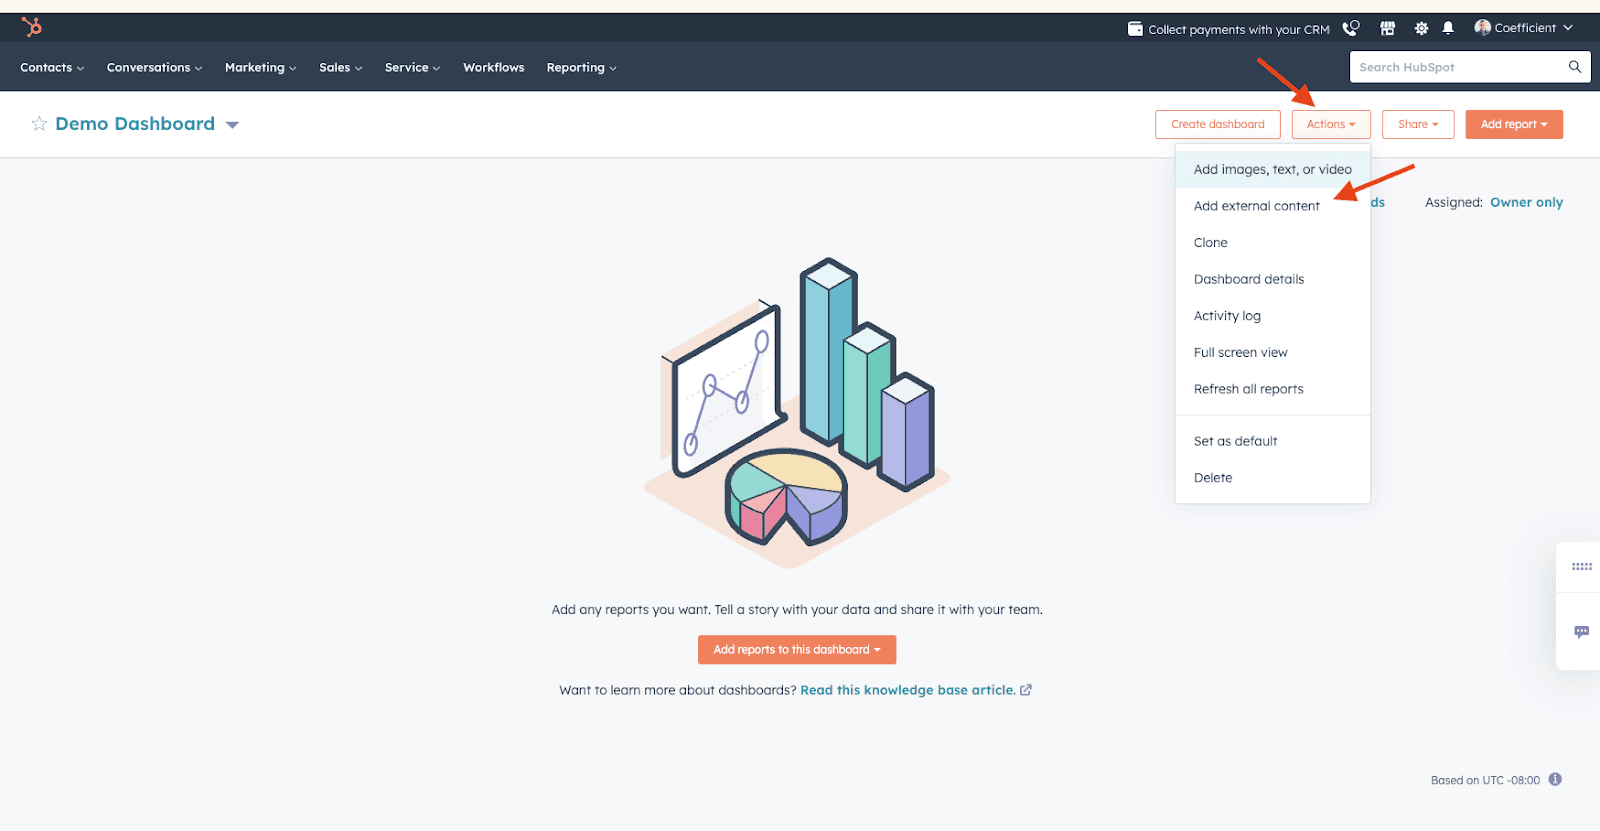
Select "Actions" located at the top-right corner and then opt for "Add external content."
Paste the Embed Link and Save:
In the "External content URL" field, paste the copied embed link from Google Sheets.
Click "Add" to embed the chart.
Voila! Your interactive Google Sheet chart is now live within your HubSpot dashboard.
Advanced Techniques and Future Considerations
Leveraging Google Sheets Formulas: Take advantage of the powerful formulas within Google Sheets to manipulate your data and create even more insightful visualizations within your embedded charts.
Dashboard Design Considerations: Strategically placing and combining embedded charts with other dashboard elements like text widgets and KPIs can create a cohesive and impactful data narrative.
Exploring Third-Party Integrations: While not directly addressed here, the world of marketing technology is vast. Investigate third-party tools that might further enhance your data visualization capabilities within HubSpot dashboards.
Troubleshooting Common Issues When Embedding Google Sheets Charts in HubSpot Dashboards
While embedding Google Sheets charts in HubSpot dashboards offers numerous benefits, you might encounter some roadblocks along the way. Below is an analysis of typical problems along with corresponding solutions to help you regain momentum:
Issue 1: Embed Link Not Working
Solution 1 - Verify Google Sheet Sharing Permissions: Ensure the Google Sheet containing your chart is shared appropriately. Anyone who needs to view the embedded chart in HubSpot must have access to the Google Sheet itself. Double-check sharing settings and grant the necessary permissions.
Solution 2 - Republish the Chart: Sometimes, glitches can occur during the publishing process. Head back to your Google Sheet, click the three dots (...) on your chart, and choose "Publish chart" again. Regenerate the embed link and try embedding it in HubSpot once more.
Solution 3: Ensure that the URL begins with http://, https://, or //.
Issue 2: Chart Not Updating in HubSpot
Solution 1 - "Automatically Republish" Setting: Did you select "Automatically republish when changes are made" during the publishing process in Google Sheets? If not, any changes to the data won't automatically reflect in the embedded chart. Republish the chart and ensure this option is selected.
Solution 2 - Manual Refresh: Even with automatic republishing enabled, there might be a slight delay before the embedded chart updates in HubSpot. Try manually refreshing the dashboard to see if the latest data reflects.
Issue 3: Limited Chart Functionality
Solution 1 - Chart Complexity: While most chart types should work seamlessly, highly customized Google Sheets charts with very specific formatting or functionalities might encounter compatibility issues. Try using a simpler chart type or reducing excessive customization in Google Sheets.
Solution 2 - Test Different Chart Types: Experiment with various chart types offered by Google Sheets to see which ones function best when embedded in HubSpot. Some chart types might be more compatible than others.
Issue 4: Embedded Chart Appearance Issues
Solution 1 - Clear Cache and Cookies: Sometimes, cached data in your browser can lead to display problems. Try clearing your browser's cache and cookies, then revisit the HubSpot dashboard to see if the embedded chart appearance improves.
Solution 2 - Adjust Chart Size: The size of the embedded chart within your HubSpot dashboard might be causing layout issues. Resize the chart element within the dashboard editor to find the optimal size for clear visualization.
Alternative Data Visualisation Options
While embedding Google Sheets charts in HubSpot dashboards offers a powerful solution, it's not the only option for data visualization. Here are several compelling options to contemplate:
1. Built-in HubSpot Charting Tools:
HubSpot itself offers a suite of built-in charting tools within its reporting and dashboard functionalities. These tools might not offer the same level of variety as Google Sheets, but they are:
Easy to Use: Drag-and-drop functionality simplifies chart creation within the HubSpot interface.
Seamless Integration: Data from your HubSpot CRM automatically populates the charts, eliminating the need for manual data transfer.
Customization Options: While not as extensive as Google Sheets, you can still customize colors, labels, and layouts to match your branding.
2. Third-Party Data Visualization Tools:
The world of marketing technology boasts a vast array of third-party data visualization tools that integrate with HubSpot. These tools can offer:
Advanced Chart Types: Explore options beyond basic bar and line charts, such as heatmaps, treemaps, and network graphs for a more nuanced data story.
Real-Time Data Updates: Some tools provide real-time data refreshes within your dashboards, ensuring you always have the most current information visualized.
Interactive Features: This allows users to drill down into specific data points, filter information, and explore the data more interactively.
Popular Third-Party Options:
Superjoin: You can use Superjoin to build complex and highly customized reports directly on Google Sheets, these reports update automatically.
Looker: Looker is a robust business intelligence platform with advanced data visualization capabilities and seamless HubSpot integration.
Tableau: A leader in data visualization, Tableau offers a wide range of chart types, interactive features, and a user-friendly interface.
Domo: Domo is a cloud-based platform that focuses on data storytelling and offers pre-built dashboards for various marketing and sales use cases.
Sisense: Another powerful BI platform known for its drag-and-drop interface and ability to handle large datasets. Check it out here.
3. Custom-Coded Dashboards:
For organizations with in-house development resources, building custom-coded dashboards offers the ultimate level of control and flexibility. This approach allows for:
Highly Tailored Visualizations: Create visualizations that perfectly align with your specific data needs and branding.
Advanced Interactivity: Develop dashboards with interactive features like custom filters, drill-down capabilities, and dynamic chart updates.
Integration with External Data Sources: Connect your custom dashboards to various data sources beyond HubSpot for a truly holistic view.
Choosing the Right Option:
The best data visualization option depends on your specific needs and resources. Consider factors like:
Technical Expertise: Do you have in-house developers for custom coding, or do you require a user-friendly solution?
Data Complexity: How complex is your data and what level of visualization do you need?
Integration Needs: Does your data reside solely within HubSpot, or do you require connections to external sources?
Budget: Free and paid solutions are available, so determine your budget constraints.
Conclusion
Integrating Google Sheets charts into a HubSpot dashboard offers a seamless way to consolidate and visualize data within your CRM and marketing automation platform. By following the step-by-step guide outlined above and leveraging the benefits of this integration, you can make informed decisions and drive business growth effectively.
Whether you're tracking sales performance, monitoring marketing metrics, or analyzing customer trends, embedding Google Sheets charts into HubSpot dashboards empowers you to stay informed and agile in today's dynamic business landscape. Start harnessing the power of data visualization to unlock new insights and drive success for your organization.
Say Goodbye To Tedious Data Exports! 🚀
Are you tired of spending hours manually exporting CSVs from different tools and importing them into Google Sheets?
Superjoin is a data connector for Google Sheets that connects your favorite SaaS tools to Google Sheets automatically. You can get data from these platforms into Google Sheets automatically to build reports that update automatically.
Bid farewell to tedious exports and repetitive tasks. With Superjoin, you can add 1 additional day to your week. Try Superjoin out for free or schedule a demo.
HubSpot dashboards are a powerful tool for visualizing your sales and marketing data in a single, digestible view. But what if you could leverage the robust charting capabilities of Google Sheets within your HubSpot environment? Well, you can! This blog will guide you through the process of embedding Google Sheets charts into your HubSpot dashboards, unlocking a new level of data visualization and analysis.
Why Embed Google Sheets Charts into a HubSpot Dashboard?
HubSpot dashboards are a cornerstone for many organizations, providing a centralized location to visualize key sales and marketing metrics. However, the built-in chart options, while functional, can feel restrictive. Here's where Google Sheets steps in:
Chart Variety: Google Sheets offers a much wider range of chart types than HubSpot's native selection. Explore scatter plots to uncover relationships between variables, waterfall charts to understand the cumulative impact of factors, stock charts to track trends over time, and many more!
Customization Granularity: Unleash your inner data artist! Google Sheets allows for in-depth customization of chart elements like axes, data labels, and overall look and feel. Tailor your charts to align perfectly with your brand identity and ensure clarity for viewers.
Live Updates: Gone are the days of manually recreating charts for your HubSpot dashboard. By embedding a live Google Sheet chart into Hubspot, any updates to the underlying Google Sheets are automatically reflected within the dashboard. This ensures your visualizations are always fresh and based on the latest information.
These benefits combined significantly enhance the effectiveness of your HubSpot dashboards. Imagine a sales dashboard showcasing a dynamic scatter plot revealing the correlation between marketing spend and lead generation, or a marketing ROI dashboard featuring a captivating stock chart visually depicting campaign performance over time. The possibilities are truly endless.
Steps to Embed Google Sheets Charts into HubSpot Dashboards
Now, let's get down to business! Here's a step-by-step guide:
First of all, let's utilize a sample dataset to demonstrate how to embed Google Sheets charts in HubSpot dashboards. For detailed instructions on connecting HubSpot to Google Sheets, please refer to our blog “How to Integrate HubSpot to Google Sheets Seamlessly”.

A. Create Your Google Sheet Chart:
In your Google Sheet build your desired chart using the available options.

Customize the chart's appearance to your liking using the formatting tools.
B. Publish the Chart for Embedding:
Select the ellipsis symbol (...) located at the upper-right corner of your chart.

Select "Publish chart."

Under the "Link" tab, ensure "Interactive" is selected. This allows for user interaction with the chart within HubSpot.

Click "Publish" and then "OK" in the confirmation dialog.

Copy the Embed Link: In the publish dialogue box, you'll see a link labeled "Embed." This is the link you'll use to embed the chart in HubSpot.

C. Add External Content to Your HubSpot Dashboard:
Log in to your HubSpot account and navigate to Reporting & Data > Dashboards.

Select the dashboard where you want to embed the chart.

Select "Actions" located at the top-right corner and then opt for "Add external content."

Paste the Embed Link and Save:
In the "External content URL" field, paste the copied embed link from Google Sheets.
Click "Add" to embed the chart.
Voila! Your interactive Google Sheet chart is now live within your HubSpot dashboard.
Advanced Techniques and Future Considerations
Leveraging Google Sheets Formulas: Take advantage of the powerful formulas within Google Sheets to manipulate your data and create even more insightful visualizations within your embedded charts.
Dashboard Design Considerations: Strategically placing and combining embedded charts with other dashboard elements like text widgets and KPIs can create a cohesive and impactful data narrative.
Exploring Third-Party Integrations: While not directly addressed here, the world of marketing technology is vast. Investigate third-party tools that might further enhance your data visualization capabilities within HubSpot dashboards.
Troubleshooting Common Issues When Embedding Google Sheets Charts in HubSpot Dashboards
While embedding Google Sheets charts in HubSpot dashboards offers numerous benefits, you might encounter some roadblocks along the way. Below is an analysis of typical problems along with corresponding solutions to help you regain momentum:
Issue 1: Embed Link Not Working
Solution 1 - Verify Google Sheet Sharing Permissions: Ensure the Google Sheet containing your chart is shared appropriately. Anyone who needs to view the embedded chart in HubSpot must have access to the Google Sheet itself. Double-check sharing settings and grant the necessary permissions.
Solution 2 - Republish the Chart: Sometimes, glitches can occur during the publishing process. Head back to your Google Sheet, click the three dots (...) on your chart, and choose "Publish chart" again. Regenerate the embed link and try embedding it in HubSpot once more.
Solution 3: Ensure that the URL begins with http://, https://, or //.
Issue 2: Chart Not Updating in HubSpot
Solution 1 - "Automatically Republish" Setting: Did you select "Automatically republish when changes are made" during the publishing process in Google Sheets? If not, any changes to the data won't automatically reflect in the embedded chart. Republish the chart and ensure this option is selected.
Solution 2 - Manual Refresh: Even with automatic republishing enabled, there might be a slight delay before the embedded chart updates in HubSpot. Try manually refreshing the dashboard to see if the latest data reflects.
Issue 3: Limited Chart Functionality
Solution 1 - Chart Complexity: While most chart types should work seamlessly, highly customized Google Sheets charts with very specific formatting or functionalities might encounter compatibility issues. Try using a simpler chart type or reducing excessive customization in Google Sheets.
Solution 2 - Test Different Chart Types: Experiment with various chart types offered by Google Sheets to see which ones function best when embedded in HubSpot. Some chart types might be more compatible than others.
Issue 4: Embedded Chart Appearance Issues
Solution 1 - Clear Cache and Cookies: Sometimes, cached data in your browser can lead to display problems. Try clearing your browser's cache and cookies, then revisit the HubSpot dashboard to see if the embedded chart appearance improves.
Solution 2 - Adjust Chart Size: The size of the embedded chart within your HubSpot dashboard might be causing layout issues. Resize the chart element within the dashboard editor to find the optimal size for clear visualization.
Alternative Data Visualisation Options
While embedding Google Sheets charts in HubSpot dashboards offers a powerful solution, it's not the only option for data visualization. Here are several compelling options to contemplate:
1. Built-in HubSpot Charting Tools:
HubSpot itself offers a suite of built-in charting tools within its reporting and dashboard functionalities. These tools might not offer the same level of variety as Google Sheets, but they are:
Easy to Use: Drag-and-drop functionality simplifies chart creation within the HubSpot interface.
Seamless Integration: Data from your HubSpot CRM automatically populates the charts, eliminating the need for manual data transfer.
Customization Options: While not as extensive as Google Sheets, you can still customize colors, labels, and layouts to match your branding.
2. Third-Party Data Visualization Tools:
The world of marketing technology boasts a vast array of third-party data visualization tools that integrate with HubSpot. These tools can offer:
Advanced Chart Types: Explore options beyond basic bar and line charts, such as heatmaps, treemaps, and network graphs for a more nuanced data story.
Real-Time Data Updates: Some tools provide real-time data refreshes within your dashboards, ensuring you always have the most current information visualized.
Interactive Features: This allows users to drill down into specific data points, filter information, and explore the data more interactively.
Popular Third-Party Options:
Superjoin: You can use Superjoin to build complex and highly customized reports directly on Google Sheets, these reports update automatically.
Looker: Looker is a robust business intelligence platform with advanced data visualization capabilities and seamless HubSpot integration.
Tableau: A leader in data visualization, Tableau offers a wide range of chart types, interactive features, and a user-friendly interface.
Domo: Domo is a cloud-based platform that focuses on data storytelling and offers pre-built dashboards for various marketing and sales use cases.
Sisense: Another powerful BI platform known for its drag-and-drop interface and ability to handle large datasets. Check it out here.
3. Custom-Coded Dashboards:
For organizations with in-house development resources, building custom-coded dashboards offers the ultimate level of control and flexibility. This approach allows for:
Highly Tailored Visualizations: Create visualizations that perfectly align with your specific data needs and branding.
Advanced Interactivity: Develop dashboards with interactive features like custom filters, drill-down capabilities, and dynamic chart updates.
Integration with External Data Sources: Connect your custom dashboards to various data sources beyond HubSpot for a truly holistic view.
Choosing the Right Option:
The best data visualization option depends on your specific needs and resources. Consider factors like:
Technical Expertise: Do you have in-house developers for custom coding, or do you require a user-friendly solution?
Data Complexity: How complex is your data and what level of visualization do you need?
Integration Needs: Does your data reside solely within HubSpot, or do you require connections to external sources?
Budget: Free and paid solutions are available, so determine your budget constraints.
Conclusion
Integrating Google Sheets charts into a HubSpot dashboard offers a seamless way to consolidate and visualize data within your CRM and marketing automation platform. By following the step-by-step guide outlined above and leveraging the benefits of this integration, you can make informed decisions and drive business growth effectively.
Whether you're tracking sales performance, monitoring marketing metrics, or analyzing customer trends, embedding Google Sheets charts into HubSpot dashboards empowers you to stay informed and agile in today's dynamic business landscape. Start harnessing the power of data visualization to unlock new insights and drive success for your organization.
Say Goodbye To Tedious Data Exports! 🚀
Are you tired of spending hours manually exporting CSVs from different tools and importing them into Google Sheets?
Superjoin is a data connector for Google Sheets that connects your favorite SaaS tools to Google Sheets automatically. You can get data from these platforms into Google Sheets automatically to build reports that update automatically.
Bid farewell to tedious exports and repetitive tasks. With Superjoin, you can add 1 additional day to your week. Try Superjoin out for free or schedule a demo.
FAQs
Can I embed charts from other spreadsheet platforms like Excel?
Can I embed charts from other spreadsheet platforms like Excel?
Can I edit the embedded chart directly within HubSpot?
Can I edit the embedded chart directly within HubSpot?
Are there any limitations to embedding Google Sheets charts?
Are there any limitations to embedding Google Sheets charts?
Automatic Data Pulls
Visual Data Preview
Set Alerts
other related blogs
Try it now
