template to get you started

Pipeline Creation Dashboard for Google Sheets

Pipeline Creation Dashboard for Google Sheets

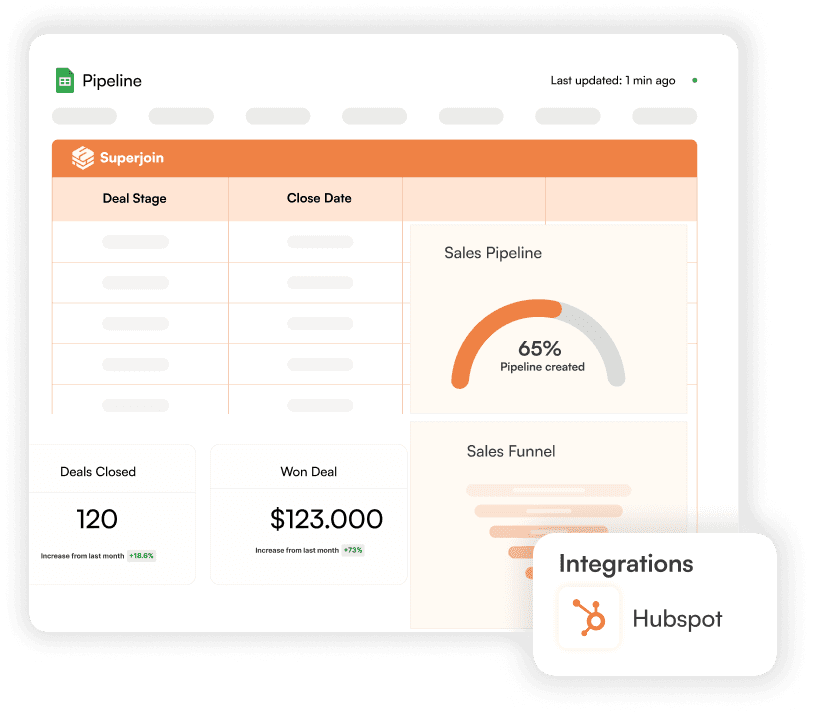
A centralized sales pipeline dashboard that enables teams to monitor performance, analyze trends, and optimize pipeline generation across regions and business segments.

A centralized sales pipeline dashboard that enables teams to monitor performance, analyze trends, and optimize pipeline generation across regions and business segments.

Pipeline Creation Dashboard Template

data sources used

HubSpot
HubSpot
HubSpot
HubSpot
HubSpot
HubSpot
HubSpot
HubSpot
HubSpot
HubSpot
HubSpot
HubSpot
HubSpot
HubSpot

"Superjoin is a fantastic tool. I would highly recommend to any company that is managing reporting out of spreadsheets, especially for companies that do not have a data engineer or data warehouse"

Director of Sales Operations

WayLeadr

"Superjoin is a fantastic tool. I would highly recommend to any company that is managing reporting out of spreadsheets, especially for companies that do not have a data engineer or data warehouse"

Director of Sales Operations

WayLeadr

Loved by 17K+ users across 400+ companies

Loved by 10K+ users across 400+ companies

Loved by 10K+ users across 400+ companies

how does this dashboard help?

how does this dashboard help?

Tracking pipeline creation should be simple. Our pre-built Pipeline Creation Dashboard helps you monitor opportunity generation, analyze pipeline distribution, and improve forecasting accuracy. All of this possible in Google Sheets.

Sync live data and get a clear view of your pipeline creation, team performance, and geographical distribution without manual updates.


What's Inside the Dashboard?


  1. Team Performance Views: Monitor pipeline distribution and trends across different teams.


  2. Sales Rep Analysis: Track individual contribution and performance metrics for each rep.


  3. Opportunity Source Tracking: Analyze pipeline from New Business, Existing Business, and Expansion.


  4. Geographical Distribution: View pipeline creation across different countries.


  5. Monthly Trend Analysis: Track performance patterns throughout the year.


  6. Pipeline Type Breakdown: Monitor different categories of pipeline creation.


Key Pipeline Metrics to Monitor:


  1. Team Performance: Track how each team contributes to overall pipeline.


  2. Individual Rep Metrics: Monitor individual sales rep performance.


  3. Source Distribution: Analyze which opportunity sources are most effective.


  4. Geographical Impact: Understand regional pipeline distribution.


  5. Monthly Trends: Track pipeline creation patterns over time.


  6. Business Type Split: Monitor distribution across new, existing, and expansion business.


Why This Dashboard Works?


  1. Comprehensive Views: See pipeline creation from multiple perspectives - team, individual, and geographical.


  2. Performance Tracking: Easy comparison between teams and sales reps.


  3. Trend Analysis: Clear visualization of monthly and quarterly patterns.


  4. Source Attribution: Track the effectiveness of different business sources.


  5. Regional Insights: Monitor geographical distribution of pipeline creation.


  6. Customizable Filters: Analyze data by various dimensions including time period, team, and opportunity type.
benefits

Key Features of Dashboards

Real-Time Data

Auto-Update dashboards that
connect with live data sources

On Google Sheets

Don’t learn any new tools, do 10X
Faster Reporting on top of Google
Sheets

Pre-Built Templates

Use pre-built templates to get
started quickly and tailor them to
your business needs

Plug & Play

Connect to your live data from
RevOps tools in 1-Click to update
these dashboards

integrations

Connect live data with Google Sheets

Try within 2 minutes. no Card required

RevOps on Sheets. Do daily reporting 10 times faster.

Install for Free

Automatic Data Pulls

Set Alerts

Visual Data Preview

no sales pitch. we promise.

RevOps on Sheets. Do daily reporting 10 times faster.

Automatic Data Pulls

Set Alerts

Visual Data Preview

data sources used

HubSpot

"Superjoin is a fantastic tool. I would highly recommend to any company that is managing reporting out of spreadsheets, especially for companies that do not have a data engineer or data warehouse"

Director of Sales Operations

WayLeadr

"Superjoin is a fantastic tool. I would highly recommend to any company that is managing reporting out of spreadsheets, especially for companies that do not have a data engineer or data warehouse"

Director of Sales Operations

WayLeadr

Loved by 10K+ users across 400+ companies